Lunch & learn tips & tricks series 2026 – part 1
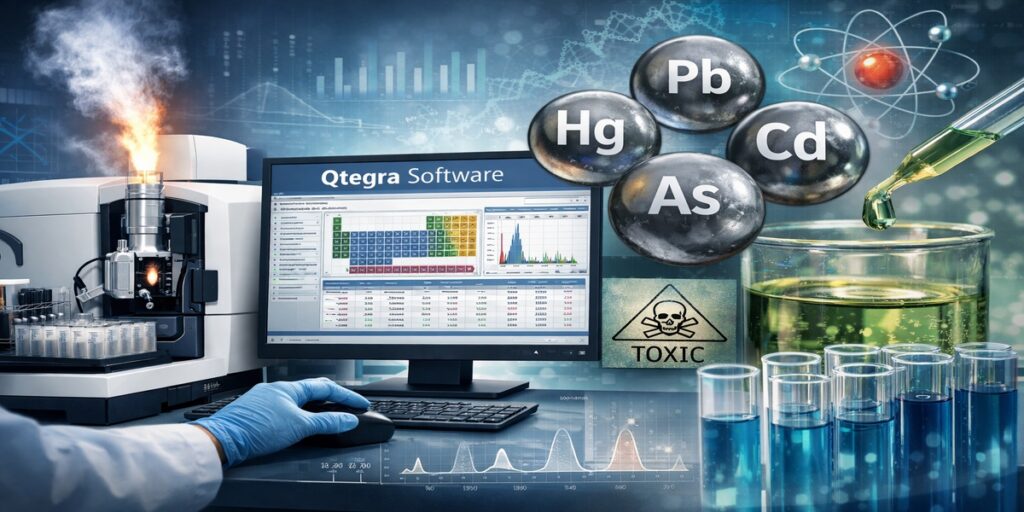
In modern analytical laboratories, efficiency, consistency, and data confidence are essential. Whether you are operating an ICP-OES or ICP-MS system, the way you use your software can significantly influence productivity and analytical performance. In the first session of our Lunch & Learn Tips & Tricks Series, we focused on one of the most common themes raised by users: how to navigate Qtegra software more effectively and optimize everyday workflows.
This session explored three key areas in detail: understanding the structure of Qtegra and the Configurator, using the Dashboard as your operational control center, and building smarter, more efficient LabBooks. Below is a structured recap of the key insights shared during Part 1.
Understanding the structure of Qtegra
One of the most valuable features of Qtegra software is its consistency across multiple instrument platforms. Whether you are working with the iCAP PRO ICP-OES, the iCAP MX ICP-MS, the iCAP 7000 OES, or Qnova ICP-MS systems, the interface and workflow logic remain familiar. This consistency reduces the learning curve when transitioning between instruments and supports standardised training across laboratories.
Qtegra consists of two primary components: the Qtegra application itself and the Configurator.
The Qtegra application is where you directly interact with your instrument. It is used to create LabBooks, control the instrument, execute analyses, and review results.
The Configurator, in contrast, defines how your system behaves at a deeper level. It controls system-level settings that underpin daily operation. Within the Configurator, users can manage features such as Fast Uptake setup, drain sensor configuration, wavelength libraries for ICP-OES systems, the Reaction Database for ICP-MS systems, and user access permissions.
Understanding the distinction between these two components helps users troubleshoot more effectively and ensures that system configuration aligns with laboratory requirements.
Using the dashboard as your central hub
When Qtegra is opened, the first screen presented is the Dashboard. The Dashboard functions as the central hub for instrument monitoring and control. From this location, users can view instrument status, monitor live operating parameters, access tuning tools, review performance checks, and identify error or interlock notifications.
For ICP-OES users, the Dashboard provides access to tune sets, source settings, AutoPeak alignment, autotuning functions, and live views such as Plasma TV. These tools allow users to confirm that the plasma and optical system are performing as expected before analysis begins.
For ICP-MS users, the Instrument tab within the Dashboard provides access to autotune routines, performance report summaries, gas flow settings, nebuliser adjustments, operating mode selection such as Standard, KED, or CCT modes, IntelliLens control, and real-time data streams.
The Dashboard should be used as a structured checkpoint before running any analysis. Confirming that all parameters are within acceptable ranges reduces the likelihood of interruptions and supports consistent performance throughout the run.
The get ready workflow: structured instrument preparation
The Get Ready function, which is launched directly from the Dashboard, provides a guided preparation workflow. This feature is designed to ensure that the instrument is fully configured and operating correctly for the selected method before analysis begins.
Within Get Ready, users can access scheduling tools that automate warmups, standby routines, shutdowns, and maintenance checks. These tools are particularly beneficial for laboratories operating multiple shifts or managing variable workloads.
For ICP-MS systems, the Get Ready workflow includes automated performance checks, autotune routines, and controlled warm-up conditions. These routines verify that the instrument is operating within its expected performance range.
By following the structured steps within Get Ready, laboratories can reduce the risk of missed preparation tasks and maintain day-to-day analytical consistency.
Building smarter LabBooks
The LabBook forms the foundation of every analytical sequence in Qtegra. A carefully constructed LabBook improves efficiency, reduces setup errors, and simplifies data review.
Users can create a LabBook from scratch or begin with a template. Templates are particularly useful for laboratories that integrate with LIMS systems or import sample lists via CSV files, as they promote standardisation and consistency.
Defining analytes
For ICP-OES methods, users must select appropriate wavelengths and evaluate potential spectral interferences. For ICP-MS methods, users select the required masses, consider isobaric and polyatomic interferences, and use the Reaction Database to support reaction mode selection.
Careful analyte selection at this stage helps prevent complications later in the analytical workflow.
Configuring acquisition parameters
Acquisition parameters define how the instrument collects data.
For ICP-OES systems, this includes selecting viewing modes, choosing wavelength ranges such as iFR or eUV, and defining integration times.
For ICP-MS systems, this includes selecting operating modes such as Standard, KED, or CCT, configuring Reaction Finder options, enabling Intelligent Matrix Handling, and defining digital trigger settings.
Thoughtful parameter configuration ensures that data quality objectives are met without unnecessary reanalysis.
Using intelligent uptake and rinse
The Intelligent Uptake and Rinse feature detects when the sample or rinse solution reaches the nebuliser. This ensures consistent timing across samples and improves overall throughput. In high-throughput environments, this feature contributes to both efficiency and reproducibility.
Calibration and quantification strategy
Calibration design is central to reliable quantification. Qtegra allows users to manage global standards, configure dilution tools, select calibration fit types, assign internal standards, and establish quality control samples.
For ICP-OES systems, users can define standard ranges and switch points. For SemiQuant workflows, Relative Sensitivity Factors can be applied.
Establishing these parameters during LabBook creation ensures that data validation is straightforward once analysis is complete.
Autosampler and sample list setup
For laboratories using the iSC-65 autosampler, features such as StepAhead, custom rack definitions, colour-coded sample views, and visual integrity checks support efficient sequence management.
When constructing the sample list, users should clearly define sample types, establish a logical sequence order, and configure column layouts appropriately. Setting flags and limits during initial setup simplifies the data review process and supports quality assurance.
Why workflow optimisation matters
Optimising Qtegra usage does not require learning new software features. Instead, it involves using existing tools more strategically. By treating the Dashboard as a pre-run checkpoint, using Get Ready consistently, and constructing LabBooks with long-term efficiency in mind, laboratories can reduce downtime, improve reproducibility, and strengthen confidence in analytical results.
Looking ahead to part 2
In Part 2 of the Qtegra Tips & Tricks series, we will focus on post-analysis best practices. Topics will include interpreting signal intensities, reviewing calibration performance, evaluating recoveries and readbacks, applying flags effectively, exporting data, and implementing practical workflow improvements discussed in Part 1.
By building a structured approach to both preparation and data review, laboratories can transform routine analysis into a streamlined, reliable, and repeatable process.
We look forward to continuing the discussion in Part 2.
Acknowledgement
I would like to thank Matthew Gregory Field Applications Scientist, North EMEA, Trace Elemental Analysis and David Fishwick Field Applications Scientist, North EMEA, Trace Elemental Analysis for the support on this blog and the webinars
Sign up for our webinars live and on demand.
English
- Lunch and Learn Tips and Tricks Series: Qtegra Part 1
- Lunch and Learn Tips and Tricks Series: Qtegra Part 2
- Lunch and Learn Tips and Tricks Series: Trace Elemental Analysis (ICP-OES & ICP-MS)
- Trace Elemental Analysis: Ask the Expert
Deutsch
- 19. März 2026 Interne Standards in der ICP-OES: Ein Praxisguide für zuverlässige Qualitätssicherung im Labor
- 18. Juni 2026 Fehler reduzieren, Durchsatz steigern: Autoverdünnung mit PrepFast am ICP-MS
- 17. September 2026 ICP-OES smarter nutzen: Probendurchsatz erhöhen, Ressourcen sparen
- 17. Dezember 2026 Qtegra ISDS Software Unlocked – Live im Expertengespräch
Visit us on LinkedIn: #Qtegra, #ICPMS, #ICPOES, #TraceElementalAnalysis
Internal Standards in ICP-OES: A Practical Guide to Better Accuracy and Precision
In ICP-OES analysis, maintaining reliable accuracy and preci...
Read More
Cheap, Trendy – and Toxic? High Levels of Cadmium in Necklaces Have Been Reported Lately
Valentines Day is an opportunity to show your partner (or yo...
Read More
Deciphering Selenium Nutrition Using Speciation Analysis with ICP-MS
Many elements, such as chromium, zinc or selenium are consid...
Read More
Advancements in Thorium Isotope Analysis: The Role of Neoma MS/MS MC-ICP-MS
Thorium (Th) isotope analysis is important across various sc...
Read More