
The equation of trend line in these graphs is used to convert portable XRF readings (in unknown samples) from intensity to percent.
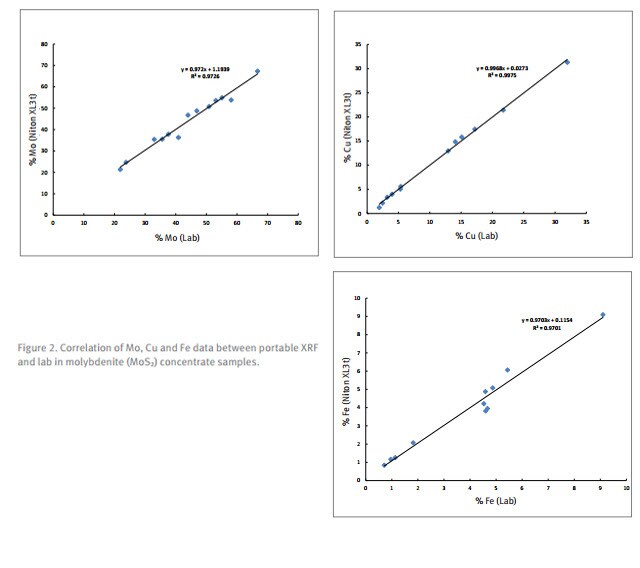
The coefficient of determination, the R2 value, is a measure of how closely the data sets correlate with each other, where a perfect correlation would have an R2 of 1. The correlation for Mo, Cu and Fe are 97%, 99% and 97%, respectively (see Figure 2). The m value beside x in the trendline equation indicates the accuracy of the results, with all three elements showing excellent agreement. For additional information, including the conclusions reached, please view the Using Portable XRF Instruments for Analyzing Ore Concentrates and Grade Control application note.

Potash: A Look at the World’s Most Popular Fertilizer
Uses, Types, Production, and USGS Data Potash, pronounced po... Marlene Gasdia-Cochrane, Editor
Read More
Best Practices for Accurate In Situ Geochemical Analysis
In situ geochemical analysis refers to elemental testing per... Mathieu Bauer
Read More
What Is In Situ Geochemical Analysis — And Why It Is Critical for Modern Field Operations
In situ geochemical analysis has become a cornerstone of mod... Mathieu Bauer
Read More
Nickel Ore Analysis: Boosting Mining Quality with WDXRF
Accurate analysis of nickel ores is essential for efficient ... Jill Staggert
Read More

Leave a Reply