Search Thermo Fisher Scientific

Imaging enhanced flow cytometer enables combined morphology and flow data analysis
- The award-winning Invitrogen Attune CytPix Flow Cytometer combines acoustic focusing with a high-speed brightfield camera for simultaneous high throughput flow cytometry and high resolution brightfield imaging.
- Automated image analysis with the Attune Cytometric Software translates event features into distinct morphometric parameters that can be combined with standard fluorescence and scatter parameters.

The Attune CytPix Flow Cytometer was named one of the 2023 Edison Awards™ winners in the Medtech category. The Edison Awards is among the most prestigious accolades honoring excellence in new product and service development, design, and innovation.

Acoustic-focusing enabled rapid brightfield imaging
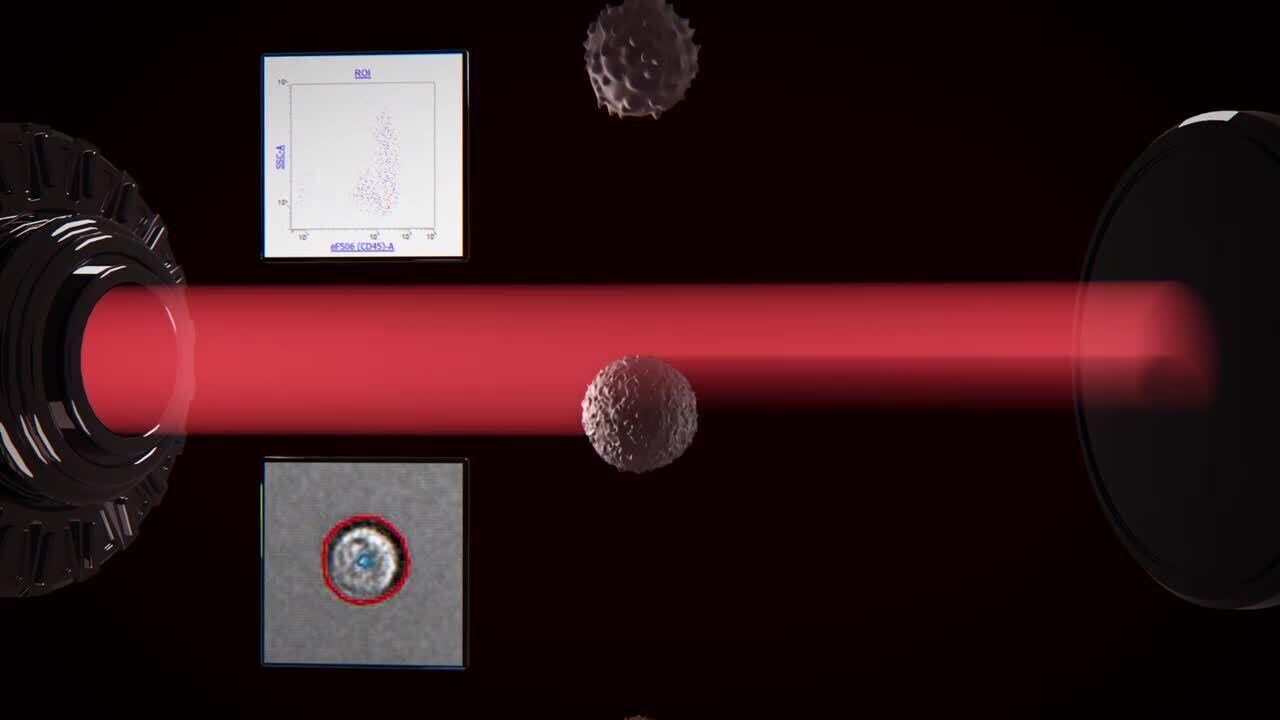
As samples are acquired on the Attune CytPix Flow Cytometer, the high-speed brightfield camera captures and stores images of detected events at a rate up to 6,000 images per second, depending on the flow rate and image size. For greater flexibility, Attune Cytometric Software lets you adjust the image capture frequency as needed and select a specific gate for image capture, if required. Acoustic focusing helps to position the cells so that a sharp image is obtained.
Acoustic focusing positions cells for optimal imaging
Without acoustic focusing (left), beads appear off-center and often blurry. Acoustic focusing (right) reduces lateral position variation, temporal variations, and depth of field limitations to obtain a sharp image.

Automated image analysis for morphometric parameters
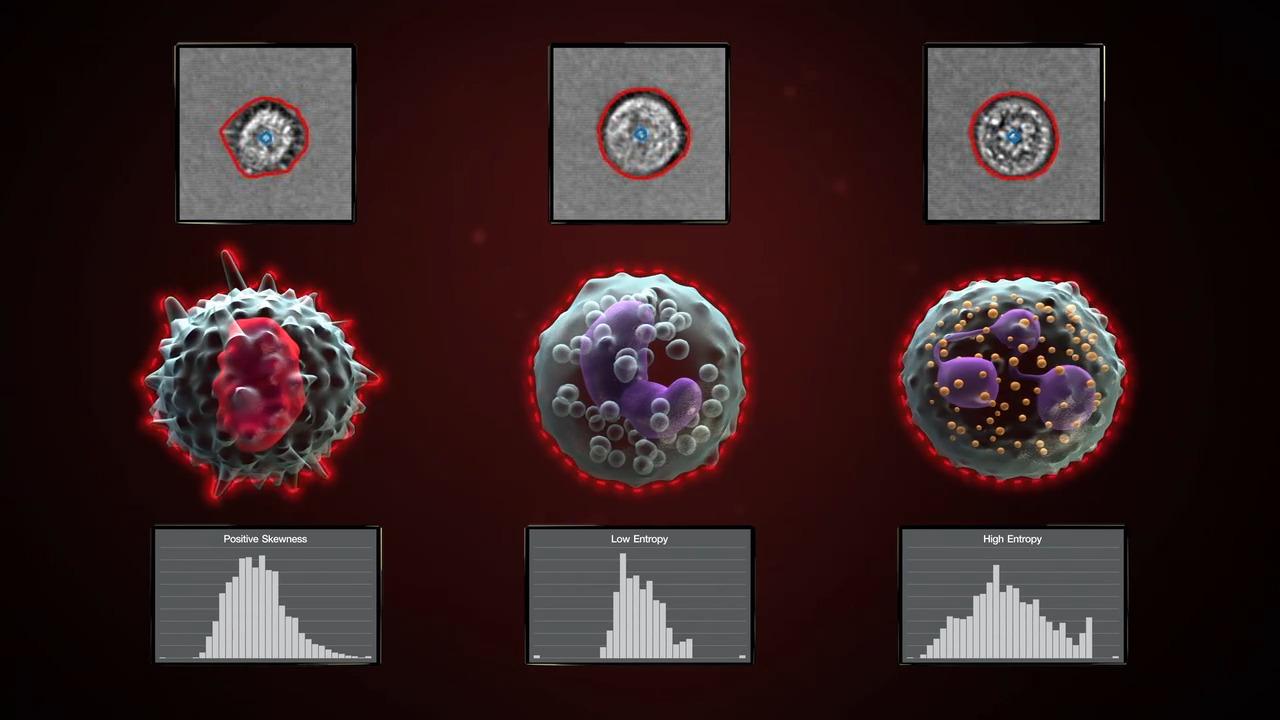
The Attune Cytometric Software has automated image analysis capability to derive morphometric parameters using models pre-trained on leukocytes and beads. The software processes images at a rate of up to 1,000 images/second and can be managed by users in a processing queue that runs in the background of the software. These extended image-based parameters provide data to confirm singlets with cell count (Particle Count) and morphology features such as roundness (Circularity), size (Area Square), shape (Eccentricity) and complexity (Entropy). Gating on these extended parameters allows you to quickly and accurately identify populations of interest and confirm gating strategy with little or no manual review.
Imaging-enhanced flow cytometry applications
Images of individual events and derived morphometric data can benefit an extensive, almost limitless, range of flow cytometry applications. The range of capabilities includes:
Optimize and confirm gating strategy
Use image-derived data to set gates to exclude doublets and debris and confirm gate accuracy with images.
Deeper characterization of cell populations
Document and characterize morphologically distinct populations within existing flow protocols.
Analyze cell-to-cell interactions
Visualize and differentiate coincident events from cell-to-cell interactions.
Visualize structural features of large populations
Use high-throughput, detailed photographic evidence.
Measure derived image parameters
Using the image analysis feature of the Attune Cytometric Software 6.0
High-throughput quality control
Detect quality issues quickly by adding rapid imaging to cell culture QC workflows
Optimize gating strategy. Even robust manual singlet gating is error-prone and remains a subjective decision point in almost all flow cytometry assays. Imaging can be used to confirm and adjust gates to include only single cells of interest.
Here, an experienced user has gated singlets confidently. After evaluating the manual singlet gate, the CytPix image-derived parameter ParticleCount reveals this gate contains more than 4% aggregates.
Perhaps most importantly, these events contain cells of clearly different phenotypes which could lead to incorrect conclusions regarding double positive events (especially in rare populations).

Cell culture QC. Adding rapid imaging to quality control (QC) workflows can detect and track down cell culture issues early in the process. In one lab, for example, a routine passage check of a Ramos (lymphoma) cell culture observed reduced cell counts and survival despite appearing confluent. Further investigation revealed substantial microbial contamination, but when and where did it begin?
Because the cell line had previously been analyzed on the Attune CytPix Flow Cytometer, the researchers went back to the images and were able to document the microbial infection at least five days earlier. At that time, the early signs were dismissed as debris, but the retrospective evaluation demonstrated shared characteristics with the problematic cells in culture. Tracing the infection helped the lab establish additional laboratory procedures for screening and protection of assay-critical cell lines.

Characterize cell populations. Morphological information from images can add to the richness of flow cytometry data. For example, the figure shows an otherwise conventional apoptosis assay using Annexin V and PI, adding cell imaging to characterize cells in each population to reveal morphologically distinct features. These insights could not have been gained from multiplex staining alone.

Analyze cell-to-cell interactions. Imaging can even show interactions between cells. In the figure, engineered CAR-T immunotherapy cells were co-incubated with Ramos (lymphoma) cells and stained, acquired, and imaged on the Attune CytPix Flow Cytometer. Images from quadrant Q2 (positive for both stains, acquired as a single event) show the CAR-T cells visibly targeting the Ramos cells, clear evidence of engineered cell potency.

We previously demonstrated the power of imaging CAR-T/Ramos cell interactions. Let’s look at just the population of greatest interest, the double positive events, to learn more. We can now use extended image-derived parameters (circularity vs skewness of intensity) to further examine the features of these populations and refine gating on these events, increasing data robustness. Here, we show that by gating strategies using image-based quantitative parameters can distinguish interacting cells from coincident events to more accurately analyze interacting cells.

Discover analysis opportunities
Backgating imaged cells on the Attune CytPix Flow Cytometer also allows you to use morphological features to discover interesting subpopulations that would not be apparent from flow cytometry data alone.
For example, E. coli cells incubated over time develop into two types of colony-forming units (CFUs): short CFUs that resemble single cells, and elongated structures with incomplete fission rings, representing incomplete constriction at each approximate cell length. Neither a traditional singlet gate (SSC-A vs SSC-H) nor a fluorescence gate (SSC vs nucleated stain) sufficiently separates these populations. But with the Attune CytPix imaging-enhanced flow cytometer, you can view and group the images and gate the CFU types based on their morphological characteristics.


Discrimination of two E. coli CFU types. E. coli cells were incubated overnight at 37ºC followed by 3 days at 4ºC. Samples were acquired on the Attune CytPix Flow Cytometer at 100 µL/minute. From the images, two types of CFUs were identified: (A) short colonies resembling single cells and (B) elongated structures with incomplete fission rings. Representative images from each population are shown. Backgating on the selected images demonstrated that the two populations are distinct on FSC vs SSC dot plots (orange dots, left).
Videos and demos


For Research Use Only. Not for use in diagnostic procedures.