Search
Monitoring Metabolic Health and Lipid Production in Algae
Fluorescence Assays Using the Tali® Image-Based Cytometer
(See a complete list of products discussed in this article.)
Microalgae are receiving a lot of attention as a potential source of high-value end products such as pharmaceuticals, nutraceuticals, biofuels, and other biomass coproducts. Unlike mammalian cell–based production strains that depend on expensive media and culture facilities and typically require very careful handling, microalgae are abundant, resilient, and inexpensive to grow—needing essentially only sunlight and CO2. In order to maximize the efficiency of these organisms, researchers need simple and reliable methods to monitor cell vitality and metabolic status during various phases of the production cycle. Here we demonstrate the utility of the Tali® Image-Based Cytometer, FDA esterase substrate, BODIPY® 493/503 lipid stain, and the GeneArt® Chlamydomonas Engineering Kit (which provides the algal cells and medium) to monitor metabolic activity and lipid production in the microalga Chlamydomonas reinhardtii.
Better Methods to Monitor Algal Cultures
The green alga C. reinhardtii has served as a genetic workhorse and model organism for the study of photosynthesis, plant biology, lipid metabolism, regulated gene expression, and the assembly and function of flagella [1]. More recently, because of the attractive economics of large-scale algal cultures, these organisms are being considered for the production of biofuels, specialty chemicals, and more. As is the case for all biological systems, growth and metabolic activity are affected by environmental variables (e.g., sunlight, CO2, water quality, nutrients, and temperature). Effective assays to assess changes in the culture are highly desirable to researchers developing these production systems.
Previously published results have suggested that environmentally driven changes in algal cell metabolic activity are manifested as changes in esterase activity [2], which can be monitored using the fluorogenic esterase substrate fluorescein diacetate (FDA) [3] in combination with fluorescence microscopy or flow cytometry [4]. Current methods to detect lipid production include fluorescence microscopy, flow cytometry, and gas chromatography [5]. However, fluorescence microscopy is typically not a rapid method and offers only qualitative results, whereas flow cytometry and gas chromatography require expensive instrumentation that can only be used by trained personnel.
The fluorescence-based methods presented here were developed to deliver quantitative results on metabolic activity and lipid production in C. reinhardtii without the need for expensive equipment or technical expertise. We employed the Tali® Image-Based Cytometer to monitor fluorescence from the metabolic activity indicator FDA and the lipid stain BODIPY® 493/503 dye using samples of C. reinhardtii cultured in Gibco® TAP medium. Both the C. reinhardtii cells and the medium are supplied in the GeneArt® Chlamydomonas Engineering Kit with 6 L medium.
FDA Detects Metabolic Activity
To demonstrate the ability of the Tali® instrument to detect changes in metabolic activity of the algae, untreated cells, heat-treated cells, and a 1:1 mixture of the two were stained with FDA. The signal threshold on the Tali® instrument was set by visual confirmation using the untreated sample, with cells emitting green fluorescence in excess of the threshold marked as viable cells. Using these settings, we found 57% of the cells in the untreated sample were viable and 29% of the cells in the 1:1 mixture of untreated and treated cells were viable (Figure 1). As predicted, 100% of the cells in the heat-treated sample were below the threshold and recorded as dead.
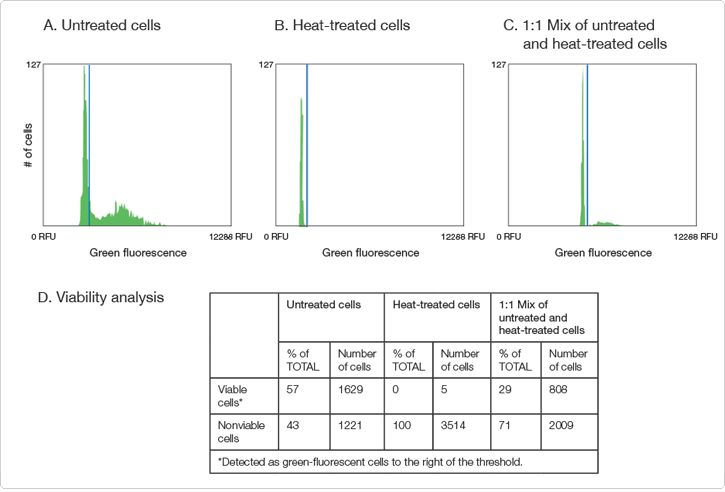 Figure 1. Monitoring changes in algal viability using FDA esterase substrate and the Tali® Image-Based Cytometer.Chlamydomonas reinhardtii cells were grown in Gibco® TAP medium. The flasks were placed into an algal chamber (Geneva Scientific) at 28°C under continuous illumination using moderate light intensities of cool fluorescent white light (50 ± 10 μE m–2 s–1) and agitation with a rotary shaker at 100–150 rpm. Two aliquots of 4-day-old cultures (OD ~0.7) were obtained from the flasks, and one of these aliquots was treated with heat. To determine viability, 1 mL each of untreated and heat-treated C. reinhardtii were centrifuged at 9,000 rpm for 20 sec. The algal cell pellets were resuspended in 200 µL 10 mM NaAc, pH 5.2, and 800 µL TAP medium, and then 1 µL FDA stock solution (10 mg/mL in DMSO) was added to each. A 20 µL aliquot of the (A) untreated or (B) heat-treated, FDA-stained cells was added to a Tali® Image-Based Cytometer slide and analyzed using the green fluorescence channel. (C) For the 1:1 mixture, 10 µL each of untreated and heat-treated cells were mixed and added to the Tali® slide and analyzed. (D) Viability analysis based on esterase activity.
BODIPY® 493/503 Stain Monitors Lipid Production
In C. reinhardtii cells grown under nitrogen-starved conditions, cellular lipid levels increase and chlorophyll levels decrease [6]. We grew C. reinhardtii with and without nitrogen and stained the cells with BODIPY® 493/503 lipid stain to detect lipid levels. By monitoring fluorescence in the green channel, we found that nitrogen-depleted environments produced algal cells with increased lipids (Figure 2C vs. Figure 2A) and decreased chlorophyll (Figure 2D vs. Figure 2B).
 | Detection of lipid production using BODIPY® 493/503 lipid stain and the Tali® Image-Based Cytometer. Chlamydomonas reinhardtii cells were grown in Gibco® TAP mediumwith nitrogen (A, B) and without nitrogen (C, D), and then stained with BODIPY® 493/503 dye. To prepare cells for imaging, 1 mL of each culture (OD ~1) was centrifuged at 2,000 × g for 10 min, and the cell pellet was resuspended in 200 µL TAP medium. Cells were stained with 10 μg/mL BODIPY® 493/503 dye for 10 min, washed 3 times with 1 mL TAP medium to remove free dye, and then resuspended in 1 mL TAP medium. A 20 μL aliquot of each sample was analyzed on the Tali® Image-Based Cytometer using the dual-fluorescence detection mode (green and red fluorescence channels). For experiment-to-experiment consistency, the green fluorescence (BODIPY® 493/503) threshold for (A) and (C) was set at 5,200 RFU; similarly, the red fluorescence (endogenous chlorophyll) threshold for (B) and (D) was set at 1,000 RFU. |
Simple Workflows, Quantitative Data
Using the Tali® Image-Based Cytometer, FDA, and BODIPY® 493/503 stain, researchers can rapidly and quantitatively analyze metabolic activity and lipid production in microalgae. In addition, our GeneArt® Chlamydomonas Engineering Kits offer the first commercially available Chlamydomonas genetic modification and expression system, providing optimized vectors, frozen cells, Gibco® TAP medium, and simple protocols to create a complete, standardized system for research and metabolic engineering.
References
- Harris EH (2001) Annu Rev Plant Physiol Plant Mol Biol 52:363–406.
- Franklin NM, Adams MS, Stauber JL et al. (2001) Arch Environ Contam Toxicol 40:469-480.
- Day JG, Deville MM (1995) Methods Mol Biol 38:81–89.
- Stauber JL, Franklin NM, Adams MS (2002) Trends Biotechnol 20:141–143.
- Cooper MS, Hardin WR, Petersen TW et al. (2010) J Biosci Bioeng 109:198–201.
- Msanne J, Xu D, Konda AR et al. (2012) Phytochemistry 75:50–59.
Resources | |
| Article Download Get a copy of this article as it appears in the print version of BioProbes 68. | Learn More About: |
FOR RESEARCH USE ONLY. NOT FOR USE IN DIAGNOSTIC PROCEDURES.