A critical first step in quantitation is tuning the instrument to identify the optimal fragment ions that deliver both sensitivity and specificity. This is true regardless of the use of triple quadrupoles, ion traps, or accurate mass systems. Traditionally, this process requires physical standards and, in the case of large panels of analytes, can be time-consuming.

But what if we could generate methods without needing all the standards on hand or even tuning them at all?
Doing so would require having a source of data that captures the optimal fragments and energies for all compounds. Enter mzCloud, a spectral library that includes up to 20 collision energies for high-energy collisional dissociation MS2 on every compound in the library.
Although generated from full scan accurate mass instruments, this information contains the energy-dependent fragment formation using a fragment technique common to triple quadrupoles and other instruments.

• Extensively curated, high-quality free online library
• Multiple fragmentation energy levels represented
• Covers a wide chemical space to include compounds relevant to all applications
• For both research and targeted screening workflows
• Contains over 32,000 compounds and 16,500,000 spectra
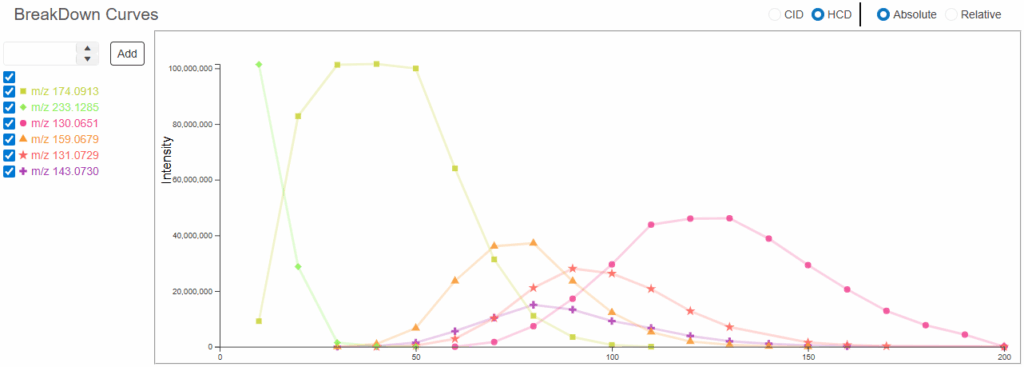
Figure 1. Breakdown curves for the top 6 fragment ions from Melatonin showing maximum energy for each fragment ion. X-axis is fragmentation energy, Y-axis is fragment intensity.
So, could we transfer the information from the library into a usable method for an instrument such as a triple quadrupole?
The answer is yes. The first step is to determine if any offset in the collision energy (eV) exists between the platform used to generate the library and the target quantitative instrument. This can be easily assessed with a small selection of compounds across the mass range to ensure that the optimal collision energy remains the same or, in cases where they are different, a correction factor can be calculated. Once this is done, it is a relatively simple matter of taking the top N most intense fragment ions from the library curves and creating the corresponding quantitative instrument methods.
In fact, we have already successfully implemented this approach: all recent triple quadrupoles from Thermo Fisher Scientific now come with a built-in database of methods generated in this fashion. The creation of a quantitative acquisition method is as simple as selecting compounds, polarity, and number of transitions from the database and proceeding with acquisition.
By automating the generation of quantitative methods from spectral library data, we significantly reduce the time and effort required for method development. This enables our customers to focus on their core research and analysis, improving productivity and accelerating scientific discovery.
For more information, join us at the upcoming user meeting or go to mzCloud.org or see the advantages of using mzCloud with Thermo Scientific Compound Discoverer software.
Visit us on LinkedIn: #mzCloud #MassSpectralLibraries

From Complexity to Clarity: Smarter PFAS Identification Workflows in Compound Discoverer Software
Per- and polyfluoroalkyl substances (PFAS) have become a maj...
Read More
Identification of Substructures in Unknowns Through MSn Data
This is the second part of a multi-part Library blog series....
Read More
Beyond Blood: Sheffield Teaching Hospitals NHS Foundation Trust Develops HRAM-Powered Method for Post-Mortem Toxicology Analysis
In a recent study published in the Journal of Analytical Tox...
Read More
Decoupling Acquisition From Data Review: Unlocking Flexibility and Efficiency in Chromatography and Mass Spectrometry Workflows
In a recent blog post we discussed how centralized data mana...
Read More