
As a scientist you are on a course to get to the rational truth, and the application of your research, for the most part, helps you get there. Yet, during your scientific exploration, you and your laboratory will be outputting vast amounts of data: no doubt in a myriad of formats and type, and while this data is uber valuable, it can also place an awkward obstacle in the path of your scientific discovery. Something that you must continually navigate.
This data can be analogue, or it might be digital. It might be related to samples you have analyzed, or tests you have performed, and their results across your workflow, data about the team in your lab, the status of the instrument, or equipment used by your analysts, the lab’s resource availability, stock information, location status, overall performance, and so on. It can be a headache to manage.
But you still need this data to drive deeper insight, to give context, and drive your business forward. And it needs to be delivered in a useful format to the people who need it to make informed decisions about your scientific mission.

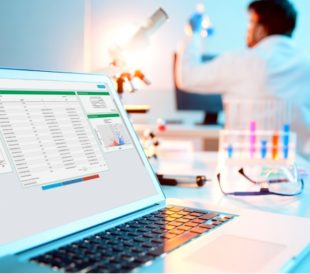
Dashboards to help you see the road ahead
One way to get around this headache is by using a Laboratory Information Management System with a dashboard interface that displays key business and laboratory insights. Using dashboards in a LIMS adds context to your lab data, and vastly helps to deliver clear insights for informed decisions. This dashboard gives instant visibility on things like resource availability, stock information, location status and lab performance, all displayed in a clear interactive format, with status information and the ability to drill down for further detail and results. The Data Analytics Solution for Thermo Scientific™ SampleManager™ LIMS software provides many dashboards that cover the bulk of the laboratory workflows and processes.
Statistical scripts for a flexible lab
Statistical Scripts enables a greater degree of flexibility when you need to interact with diverse and vast quantities of data. The Machine Learning capability within the Data Analytics Solution for SampleManager LIMS utilizes the Statistical Scripts function that’s baked into the software. Users can also take advantage of this as core functionality, and work with popular data science programming languages like R or Python through the Statistical Scripts. This combination gives access to hundreds of applications without having to leave SampleManager software, and while maintaining data governance at the same time.

Applications using Statistical Scripts functionality
In addition to performing complex calculations, the Statistical Script function within SampleManager LIMS enables plots and visualizations to be created. The vast array of visualization libraries allows for many complex and unique visualization to be tailored to the user’s exact needs.
With this combination, SampleManager LIMS users can benefit from the Statistical Scripts ability to solve for non-routine use cases and challenges. Some examples include proficiency testing, analyzing the laboratory’s annual performance, geographical information, genomic scoring, flow cytometry, automation of large data processing, analysis automation, large data visualization and sequence visualization.
SampleManager LIMS also provides an OData API which gives the ability to connect to business intelligence tools, with minimal configuration, such as Power BI, Tableau and Spotfire – so users can maintain access control and see only the data they have the correct privileges to access.
Clear the path to digital transformation
Regardless of whether your laboratory is taking its first steps in digitizing data or optimizing processes to move towards a digital transformation, tools like the Data Analytics Solution in SampleManager LIMS software provide a practical way for laboratories, across all industries, to move towards real-time data visualization and analytics. Supported along the way by the Thermo Fisher Scientific team, finally you can create applications specific to your needs and unlock the hidden value in your data.
Speak one of our experts about our Data Analytics Solutions for SampleManager LIMS software.
Lab of the Future Conference 2025: How the Digital Automated Lab, AI, and Orchestration Are Accelerating Science
Setting the stage In the heart of Amsterdam, the Beurs van ... Mark Fish
Read More
Thermo Fisher Scientific Recognized as a Star Player in Lab Informatics by MarketsandMarkets’ 360Quadrants
Laboratory informatics solutions are essential for lab users...
Read More
Benefits of Implementing a Laboratory Information Management System
Evaluating laboratory operations with advanced LIMS software...
Read More
Unlocking the Potential: The Power of Platform-Based Orchestration in the Life Sciences Industry
Across the evolving life sciences sector, organizations face...
Read More
Leave a Reply