Search

Thermo Scientific™
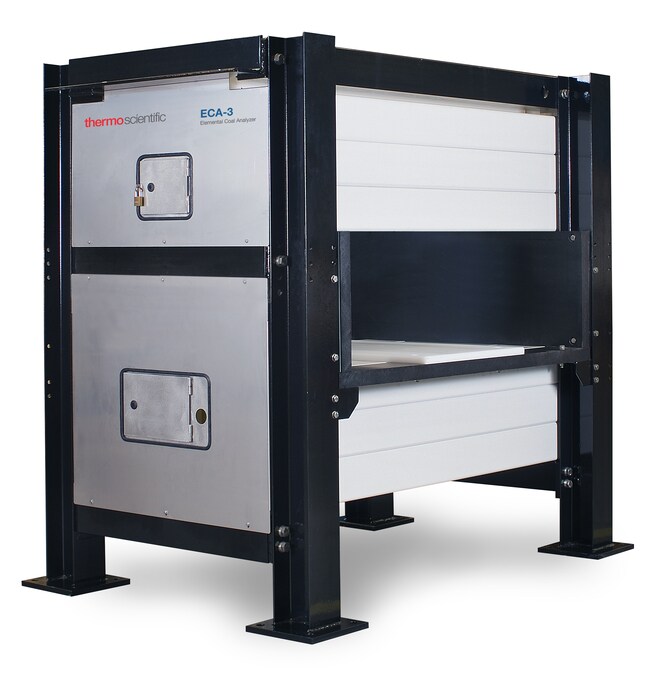
Analyseur d’éléments CrossBelt ECA
Mélangez les charbons avec succès afin de répondre aux spécifications contractuelles grâce à un système en ligne pour une analyse élémentaire rapide du flux de charbon, un tri précis et un mélange juste.
| Référence | Description |
|---|---|
| 19187 | Analyseur d’éléments CrossBelt |
Référence 19187
Prix (EUR)
-
Description:
Analyseur d’éléments CrossBelt
Les mines de charbon doivent répondre à une grande variété de spécifications des clients selon différentes qualités de charbon. L’analyseur d’éléments Thermo Scientific™ CrossBelt ECA fournit une analyse qualité en temps réel des flux de procédés critiques pour faciliter le tri, le mélange et le contrôle de dilution ‟out-of-seamˮ. La productivité est optimisée en matière de gestion des fosses, d’usines de préparation et de gestion des stocks. L’analyseur ECA est idéal pour les applications de charbon brut, d’alimentation des usines, de charbon propre et de charbon mélangé. Les centrales à charbon sont bénéficiaires grâce à la réduction de l’utilisation de charbons de qualité supérieure et plus onéreux et à l’augmentation parallèle de l’efficacité des chaudières.
L’analyseur d’éléments CrossBelt ECA est le premier analyseur sur courroie et de flux complet à utiliser la technologie d’analyse par activation neutronique aux gamma prompts (PGNAA), une technique développée et commercialisée par Thermo Fisher Scientific™ en 1984 qui a été largement utilisée pour l’analyse élémentaire en ligne du charbon des flux d’échantillons. L’utilité de cet analyseur peut être optimisée en appliquant soit le logiciel de mélange Thermo Scientific™ COBOS, soit le logiciel de suivi Thermo Scientific™ Silo pour assurer le suivi de la composition du charbon dans les accumulateurs, les stations de matière en pile ou les silos en aval.
La technologie PGNAA représente une amélioration significative par rapport aux approches analytiques à double-gamma et d’autres approches moins complexes pour la mesure des cendres sur la courroie. Elle mesure indépendamment les composants majeurs des cendres, ainsi que le soufre, puis les additionne afin de déterminer les cendres totales. C’est la raison pour laquelle elle n’est pas spécifique au charbon et qu’elle est extrêmement fiable dans les applications où la minéralogie des cendres varie ou lorsqu’il existe plusieurs types de flux ou de types de charbon. L’analyseur d’éléments CrossBelt ECA fournit également des analyses minute par minute du soufre et, avec un instrument de mesure d’humidité intégré, il peut aussi afficher les valeurs d’humidité et de BTU/lb.
Spécifications
Calculates and Reports
- Heating Value (kcal/kg, kJ/kg or BTU/ lb)
- Lbs SO2 per million BTU
Conveyor Belt Sizes
- 600 mm to 1060 mm
- 1200 mm to 1400 mm
- 1600 mm to 1800 mm
- 2000 mm to 2200 mm
DescriptionAnalyseur d’éléments CrossBelt
Measures and Reports
- Ash
- Sulfur
- Moisture
- Si02
- Al203
- Fe203
- Na20
- Ca0
- Ti02
- K20
- N
- Cl
Unit SizeEach