Search
_Hero_1440x390_144DPI.jpg)
Materials Science
3D EDS Tomography
3D elemental analysis of materials for nanoscale analysis with chemical and morphological context.
48ab - Appl/Samples/Products/Resources/Contact
The ability to perform compositional analysis, and visualize the resulting chemical maps in 3D, is essential to obtain the true elemental distribution or composition of a material, ultimately delivering new insights into the structure-function relationship of the sample.
Modern materials research is increasingly reliant on nanoscale analysis in three dimensions. Full 3D characterization includes chemical as well as imaging data, making 3D energy dispersive X-ray spectroscopy (EDS, also abbreviated EDX or XEDS) an indispensable technique. For the highest quality results, instrumentation with dynamic high-resolution imaging capabilities, as well as fast and quantitative data acquisition, is therefore required. The combination of flexibility in acquisition schemes (TEM, STEM, and EDS), the ability to easily and reproducibly optimize the experiment, and the fast and highly sensitive collection of the elemental distribution data are prerequisites for capturing the real 3D structure and composition of nanomaterials.
Electron tomography produces 3D reconstructions of materials by incrementally adjusting the angle at which the sample is observed. This produces a tilt series of images that can be digitally back projected to render the original sample volume. EDS spectra can be obtained alongside the the electron microscopy (EM) images, providing detailed elemental context. Below are just a few examples of EDS tomography use cases, covering a wide variety of scales, resolutions, and applications.
Thermo Fisher Scientific instruments offer a range of automation capabilities, allowing you to predetermine mapping conditions, drift compensation, and detector parameters, as well as autofocus and auto tilt conditions. This level of automation enables you to set up the EDS tomography experiment and then leave the system unattended for the complete data acquisition process. Visualization and reconstruction were performed with Thermo Scientific Inspect 3D and Avizo Software.
EDS tomography of P-Zn-In nanotubes, which are used as an electrode material for Na-ion and Li-ion batteries. The segregation of zinc has not been well known during synthesis; however, the elemental data clearly reveals the distribution of zinc relative to the other elements. It becomes evident that there is almost no concentration of zinc in the straight nanotubes. Sample courtesy of Dr. Reza Shahbazian Yassar, Michigan Tech University.

3D EDS TEM tomography of precipitates in an AlMgSi alloy. Sample courtesy of Thomas Kremmer and Stefan Pogatscher, University of Leoben, Austria.
EDS tomography data of organic nanoparticles in a polymer sheet.
EDS tomography data of a catalyst powder. Sample courtesy of Tampere University of Technology, Finland.
EDS tomography data of copper indium sulfide (CuInS2) nanostructures. Sample courtesy of Prof. Neerish Revaprasadu, University of Zululand, South Africa.
Example walkthrough of the EDS tomography workflow on the Talos S/TEM.
STEM and EDS tomography showing the distribution of the Palladium particles (red) relative to other elements of the vehicle aged catalyst material.
Digital slice of the reconstructed Ag-Pt core shell nanoparticle volume. Sample courtesy Prof. Yi Ding and Prof. Jun Luo, Center for Electron Microscopy, Tianjin University of Technology.
Segmented surface rendering of nanoparticles with elements present: Ag core, Platinum shell (to increase visibility, the Platinum shells have been colored semitransparent).
EDS tomography of P-Zn-In nanotubes, which are used as an electrode material for Na-ion and Li-ion batteries. The segregation of zinc has not been well known during synthesis; however, the elemental data clearly reveals the distribution of zinc relative to the other elements. It becomes evident that there is almost no concentration of zinc in the straight nanotubes. Sample courtesy of Dr. Reza Shahbazian Yassar, Michigan Tech University.
3D EDS TEM tomography of precipitates in an AlMgSi alloy. Sample courtesy of Thomas Kremmer and Stefan Pogatscher, University of Leoben, Austria.
EDS tomography data of organic nanoparticles in a polymer sheet.
EDS tomography data of a catalyst powder. Sample courtesy of Tampere University of Technology, Finland.
EDS tomography data of copper indium sulfide (CuInS2) nanostructures. Sample courtesy of Prof. Neerish Revaprasadu, University of Zululand, South Africa.
Example walkthrough of the EDS tomography workflow on the Talos S/TEM.
STEM and EDS tomography showing the distribution of the Palladium particles (red) relative to other elements of the vehicle aged catalyst material.
Digital slice of the reconstructed Ag-Pt core shell nanoparticle volume. Sample courtesy Prof. Yi Ding and Prof. Jun Luo, Center for Electron Microscopy, Tianjin University of Technology.
Segmented surface rendering of nanoparticles with elements present: Ag core, Platinum shell (to increase visibility, the Platinum shells have been colored semitransparent).
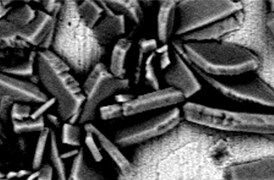
Process control using electron microscopy
Modern industry demands high throughput with superior quality, a balance that is maintained through robust process control. SEM and TEM tools with dedicated automation software provide rapid, multi-scale information for process monitoring and improvement.
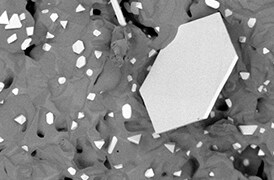
Quality control and failure analysis
Quality control and assurance are essential in modern industry. We offer a range of EM and spectroscopy tools for multi-scale and multi-modal analysis of defects, allowing you to make reliable and informed decisions for process control and improvement.
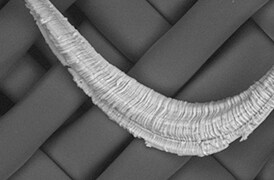
Technical Cleanliness
More than ever, modern manufacturing necessitates reliable, quality components. With scanning electron microscopy, parts cleanliness analysis can be brought inhouse, providing you with a broad range of analytical data and shortening your production cycle.
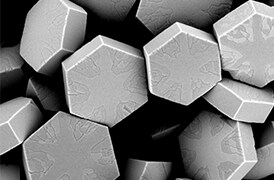
Fundamental Materials Research
Novel materials are investigated at increasingly smaller scales for maximum control of their physical and chemical properties. Electron microscopy provides researchers with key insight into a wide variety of material characteristics at the micro- to nano-scale.
Style Sheet for Cards

Battery Research
Battery development is enabled by multi-scale analysis with microCT, SEM and TEM, Raman spectroscopy, XPS, and digital 3D visualization and analysis. Learn how this approach provides the structural and chemical information needed to build better batteries.

Polymers Research
Polymer microstructure dictates the material’s bulk characteristics and performance. Electron microscopy enables comprehensive microscale analysis of polymer morphology and composition for R&D and quality control applications.

Metals Research and Characterization
Effective production of metals requires precise control of inclusions and precipitates. Our automated tools can perform a variety of tasks critical for metal analysis including; nanoparticle counting, EDS chemical analysis and TEM sample preparation.

Nanoparticles
Materials have fundamentally different properties at the nanoscale than at the macroscale. To study them, S/TEM instrumentation can be combined with energy dispersive X-ray spectroscopy to obtain nanometer, or even sub-nanometer, resolution data.

Oil and Gas
As the demand for oil and gas continues, there is an ongoing need for efficient and effective extraction of hydrocarbons. Thermo Fisher Scientific offers a range of microscopy and spectroscopy solutions for a variety of petroleum science applications.

Geological Research
Geoscience relies on consistent and accurate multi-scale observation of features within rock samples. SEM-EDS, combined with automation software, enables direct, large-scale analysis of texture and mineral composition for petrology and mineralogy research.

Catalysis Research
Catalysts are critical for a majority of modern industrial processes. Their efficiency depends on the microscopic composition and morphology of the catalytic particles; EM with EDS is ideally suited for studying these properties.

Automotive Materials Testing
Every component in a modern vehicle is designed for safety, efficiency, and performance. Detailed characterization of automotive materials with electron microscopy and spectroscopy informs critical process decisions, product improvements, and new materials.

Fibers and Filters
The diameter, morphology and density of synthetic fibers are key parameters that determine the lifetime and functionality of a filter. Scanning electron microscopy (SEM) is the ideal technique for quickly and easily investigating these features.
Style Sheet for Instrument Cards Original



Style Sheet for Komodo Tabs
Style Sheet to change H2 style to p with em-h2-header class