This year’s Lab of the Future Live event underscored the need for actionable steps to advance digital transformation strategies for life science companies. In the keynote address, Richard Milne, VP and General Manager for Digital Science, Thermo Fisher Scientific, called for a sharper focus on converting the potential on digital transformation into operational reality. “We need to find the balance between pragmatic and progressive,” Milne said. “We need to identify the pragmatic path to innovation while allowing realization of benefits along the way.”
An audience poll conducted during the keynote presentation found that “Legacy systems and processes” represent the biggest perceived hurdle to digital transformation. Organizations have already made significant investments in equipment, software, and processes. These investments are producing and capturing vast amounts of data in the laboratory, including data on the samples analyzed, tests performed, and test results. Further, most laboratories are capturing data related to the people working in the lab, as well as the instruments and equipment used.
Instead of a barrier to transformation, this data represents a tremendous opportunity to inform and advance the business. Moving from strategy to action means finding practical ways to get more from the data and systems in the laboratory. Laboratory information management systems (LIMS) like Thermo Scientific™ SampleManager™ LIMS are a pragmatic way to get actionable insight from existing lab data. The Data Analytics Solution in SampleManager LIMS includes a set of out-of-the-box dashboards, providing key business and laboratory insights on resource availability, stock information, location status and lab performance. The dashboards are designed to add context to your lab data, and deliver clear insight for informed decisions.
Managing Laboratory Resources
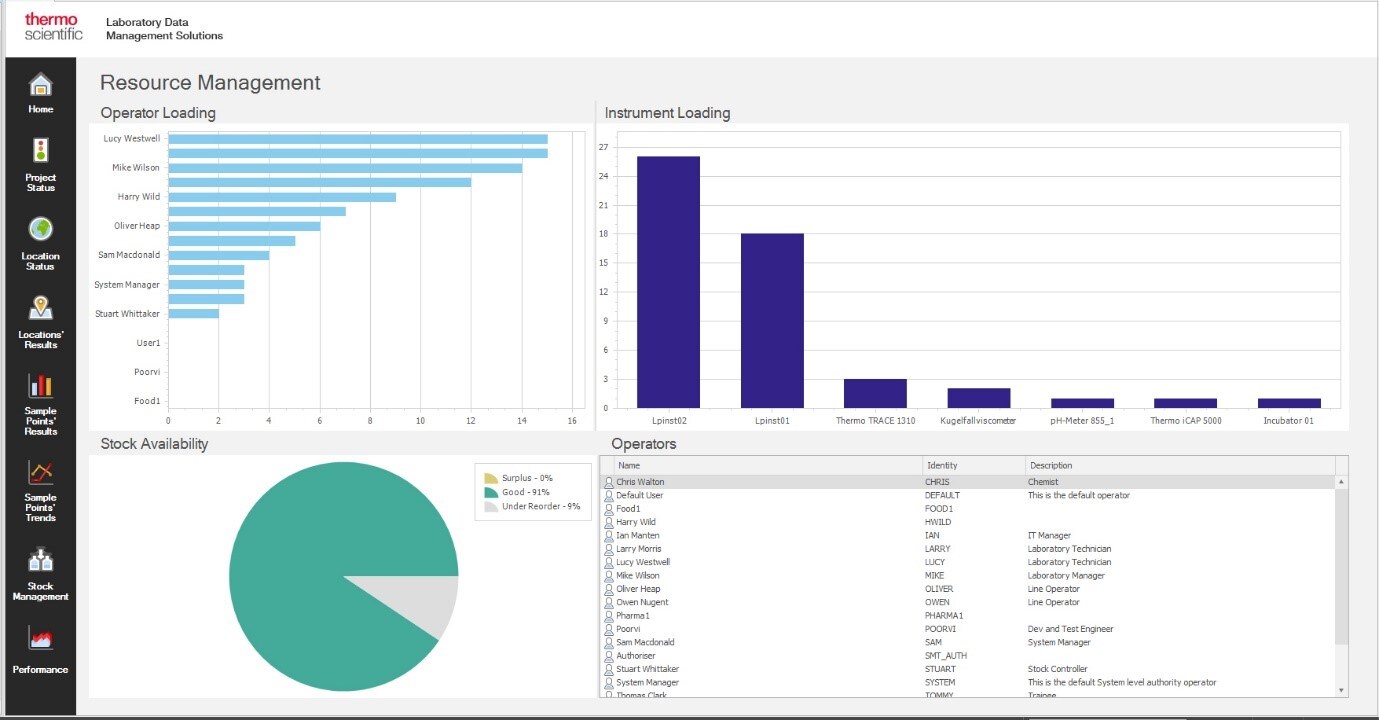
The Resource Management dashboard generates an up-to-date picture of overall lab health. The Resource Management dashboard show resource availability, including instrument uptime and workload, analyst workload and stock availability. This dashboard is particularly useful for lab managers as they assess their capacity to take on additional work, or to shift allocation of work where staff are unavailable. The Resource Management dashboard also enables lab managers to plan instrument and equipment maintenance during slower periods, for improved uptime and efficiency. Monitoring workload over time supports overall efficiency, helping better understand and plan laboratory resource usage.

Reagent and Consumable Management
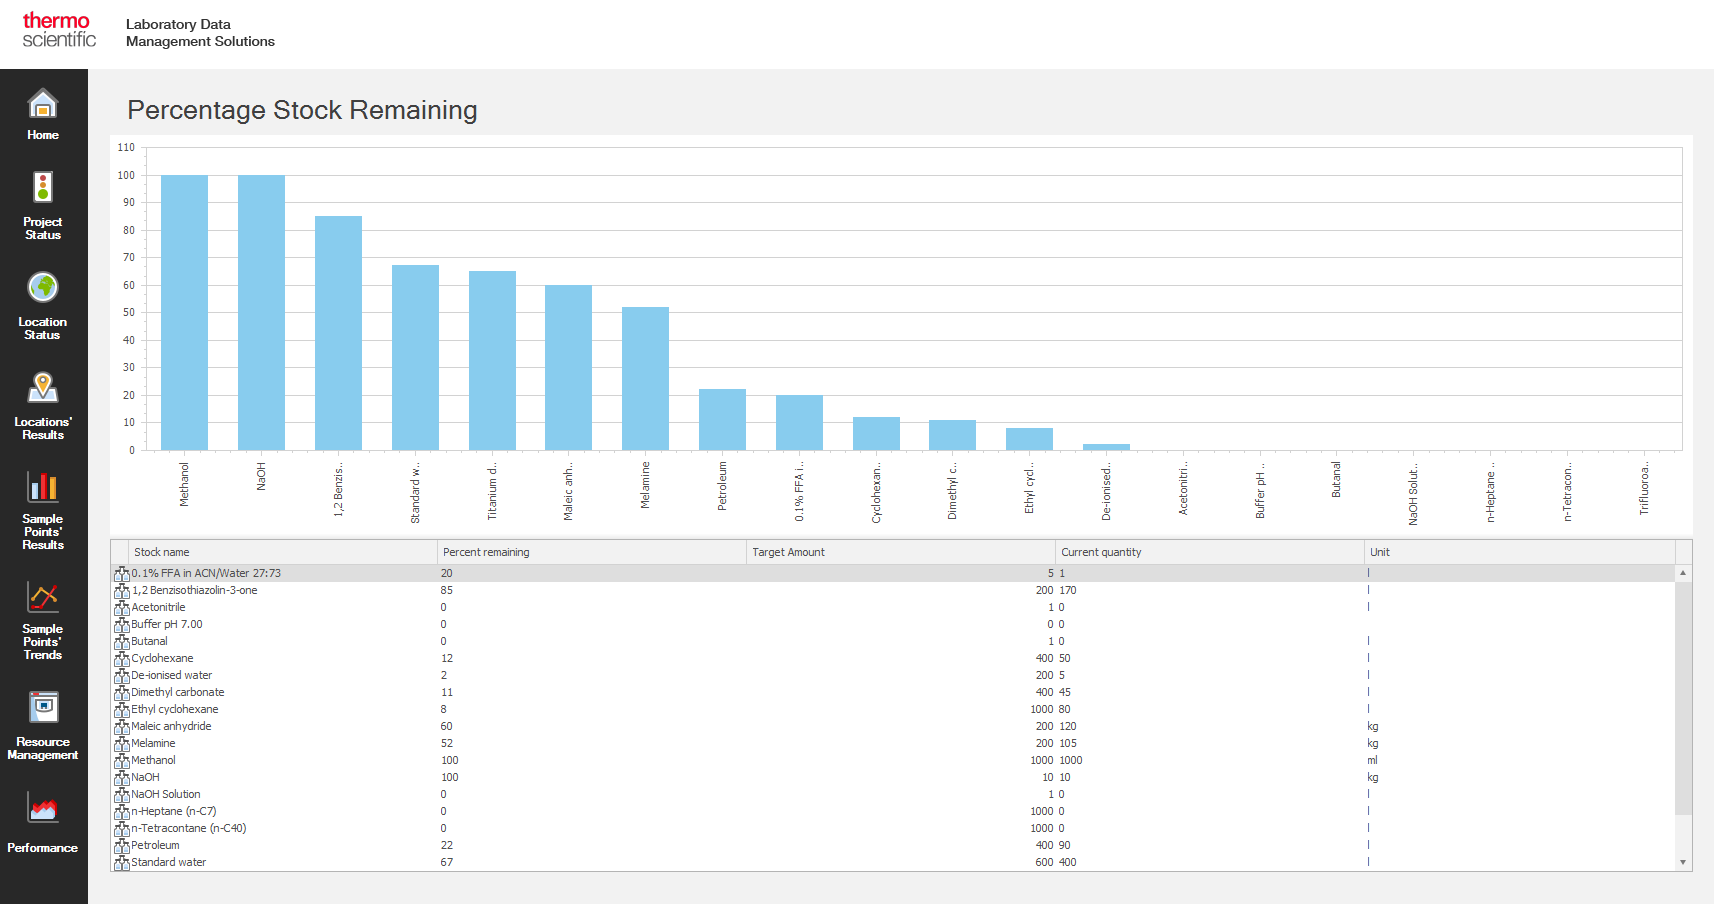
The Data Analytics Solution features enhanced Stock Management capabilities. Stock Management dashboards display location and resource availability, including reagents and consumables. For larger sites, Stock Management dashboards can show stock levels across multiple locations. This visibility helps staff intelligently source and reallocate supplies as needed. Tracking supplies using the Stock Management dashboards supports improved understanding of stock usage and distribution, resulting in better equipped labs. Effective stock management drives advanced procurement, enabling the business to accurately plan and spend only on resources which are required when and where they are needed.

Location Insights
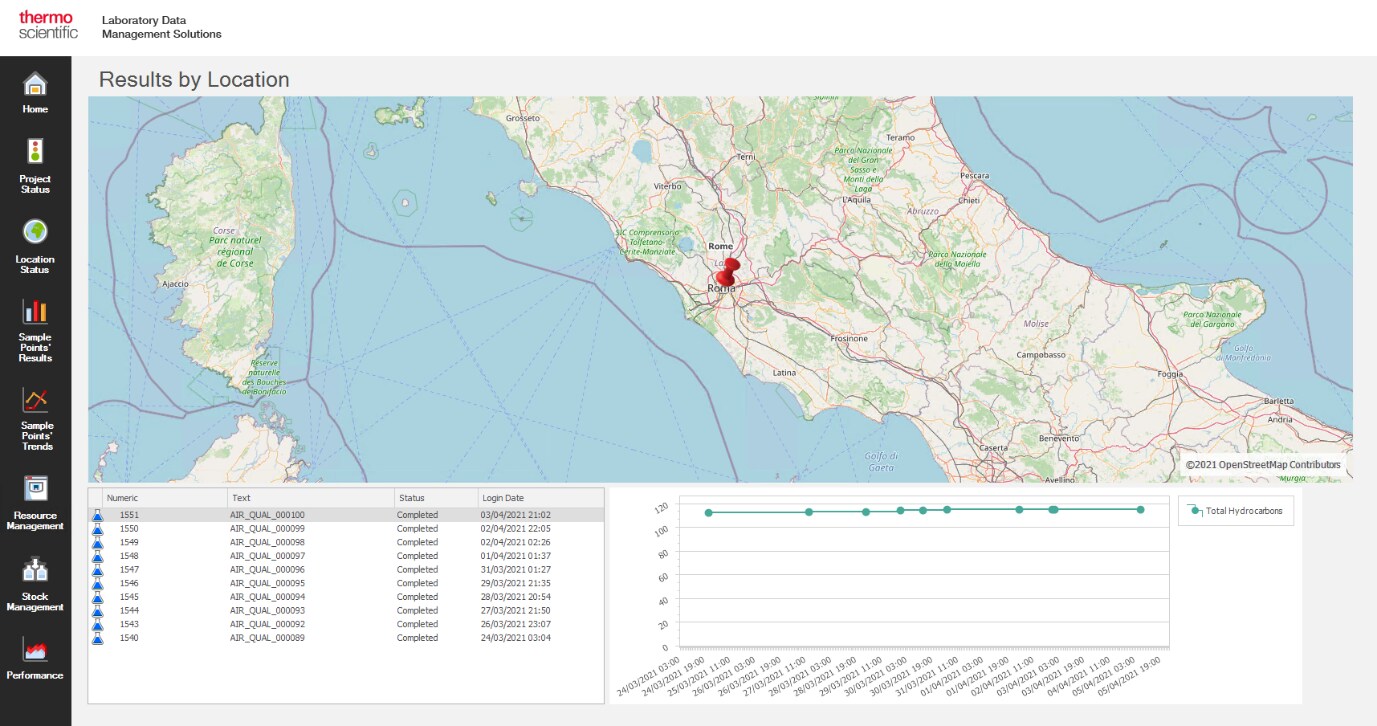
Location Views in the Data Analytics Solution show a comprehensive picture of field- or lab-based sampling points, storage facilities or other locations in your organization. The dashboard can display locations on a map or on a floorplan of the facility to enable:
- Map and floorplan views of sampling points to provide a visual indication of environmental contaminant levels using result-based markers
- Flags for good, low or urgent stock alerts across storage locations
- Interactive views which show updated results as each location is selected

Laboratory Performance Dashboards
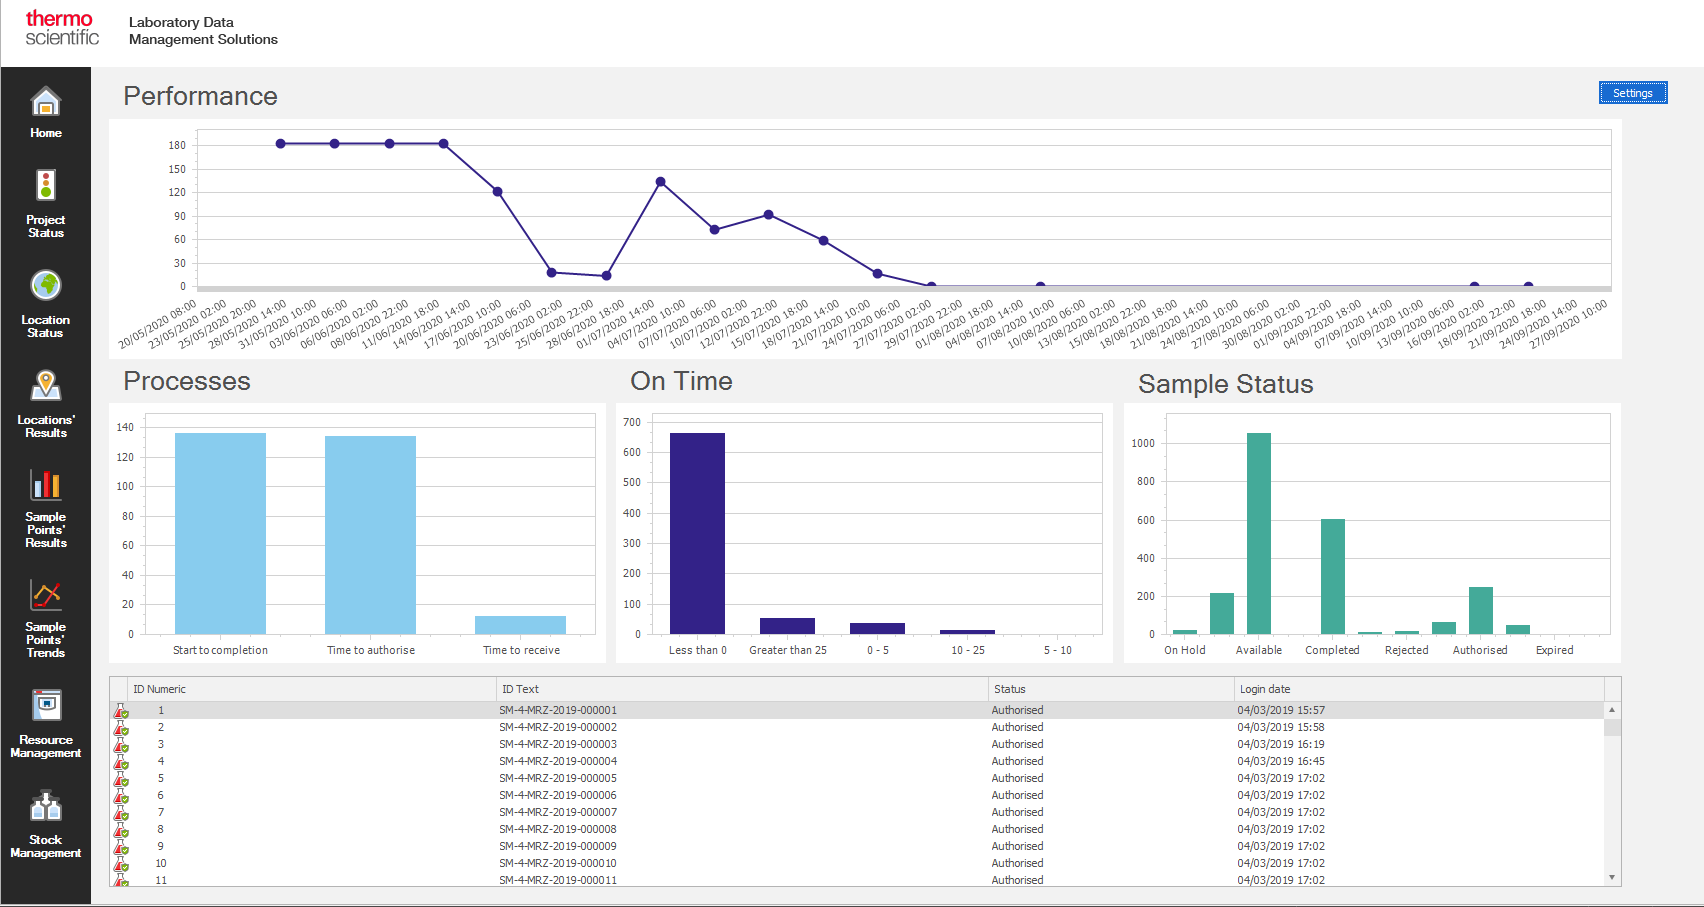
Lab Performance dashboards in the Data Analytics solution display key performance indicators such as the volume of samples at different stages of a process, percentage of on-time analyses, or average time taken at each stage. The volume of incoming samples can also be used to enable resource planning and allocation as new work comes into the lab. This information helps instantly identify process bottlenecks, so that issues can be investigated and resolved quickly.

Gaining insight and taking action
In addition to the pre-configured dashboards in the Data Analytics Solution, any data stored in SampleManager LIMS can be displayed using graphs, charts or tables and collated together in dashboards to provide relevant information to key stakeholders. This data has the potential to further inform and advance the business using Artificial Intelligence or Machine Learning to drive deeper insight.
Tools like the Data Analytics Solution in SampleManager LIMS software provide a practical way for laboratories across all industries to get more from their data. Want to learn more about moving your digital transformation from strategy to action? Join our upcoming Orchestrated Lab webinar on advancing data visualization in the lab.
Leave a Reply