 In our last article, How Can You Get Accurate Results when Measuring Bulk Polymer Pellets?, we discussed how for heterogeneous materials such as polymer pellets, a small sample may not be representative of the bulk material, so Fourier Transform Near-Infrared spectroscopy (FT-NIR) with a sample spinner accessory should be utilized.
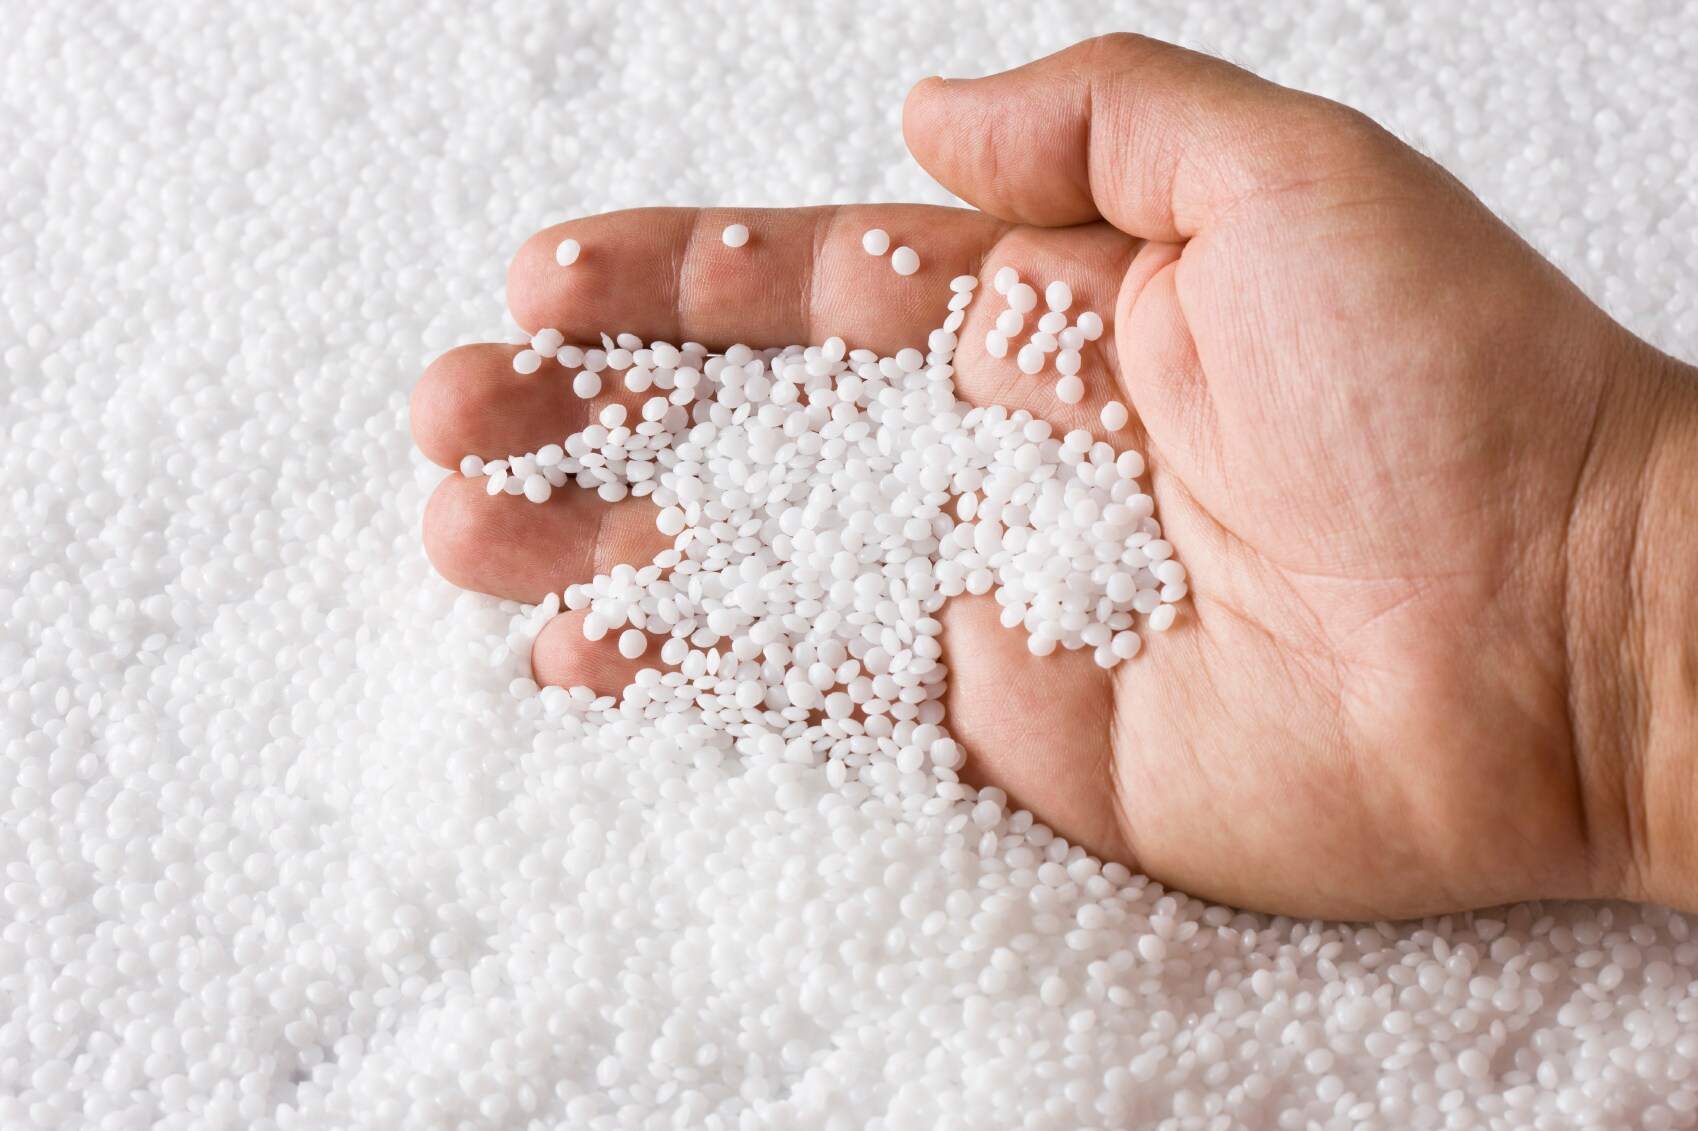
We tested our theory by conducting a study comparing two diffuse reflectance-sampling methods to determine the most efficient and accurate method for sampling polystyrene pellets. A set of 17 polystyrene pellet samples were obtained from a proprietary source. The concentration of a UV-stabilizing additive ranged from 42% to 58% by weight. The pellet shapes and sizes varied slightly from sample to sample. The samples were placed into the open powder sampling cup of the FT-NIR analyzer, which has a 47.8 mm quartz window, and analyzed by diffuse reflectance.
Once the model was developed, the validation samples were analyzed and the concentration of the additive was determined 30 times each using the sample cup spinner and the manual single point measurement technique. To accomplish the manual single point analysis, the sample was manually rotated approximately 40 degrees between each successive measurement.
Quantitative analysis software was used for all chemometric modeling. A cross-validation using a leave-one-out protocol was used to confirm the results obtained for the calibration.
Results
One spectrum was collected for each of the samples in the calibration set (13 samples total) using the sample cup spinner accessory. The total analysis time for each sample was about 15 seconds. The second derivative spectra of the calibration samples were used to develop the chemometric model.
A Norris second derivative (5 segment, 0 gap) was used to pre-treat the data. A two-term Stepwise Multiple Linear Regression (SMLR) model was constructed. Using data points of 7332 cm-1 and 5091 cm-1, a correlation coefficient of 0.9995 and RMSEC of 0.147 weight % were obtained. The first data point (7332 cm-1) of the SMLR calibration was in the first overtone region and the second point at 5091 cm-1 was in the combination band region. A cross-validation using the leave-one-out protocol gave an RMSECV of 0.179 weight %.
The additive concentration in the validation samples was determined using the SMLR model. The RMSEP (Root Mean Square Error of Prediction) was 0.302 weight % for the samples analyzed using the sample cup spinner. The results obtained using the sample cup spinner and the manual single point measurement techniques were compared. Upon visual inspection, the spectra collected using the sample cup spinner were more reproducible than those collected using the single point sampling method. The variability seen with the single point measurement method was expected because each spectrum represented only a fraction of the sample and did not account for the heterogeneity of the material. The sample cup spinner continuously rotated multiple areas of the cup through the NIR beam, therefore the single spectrum that was obtained better represents the bulk of the material.
Comparison of the standard deviation of the predicted values obtained using the sample cup spinner and the single point manual measurements clearly demonstrated that the sample cup spinner is more reproducible and more accurately predicts the additive concentration in the validation sample. The standard deviation of the results obtained using the single point measurement technique was two times more than that obtained using the sample cup spinner.
The variability in the results between the two sampling techniques for the 30 measurements is presented graphically below:

We concluded that the use of the sample cup spinner reduced the analysis time. By allowing a greater volume of sample to be analyzed, the sample cup spinner provided more representative information on a heterogeneous sample and eliminated the need to analyze multiple samples from the same lot to obtain a representative result. The FT-NIR analyzer offered an excellent alternative to traditional methods for determination of additive levels in polystyrene, with the main advantage of FT-NIR spectroscopy being that production efficiency is enhanced due to the quicker availability of reliable data.
For more details, including calibration spectra, second derivative spectra, spectra of unknown sample obtained using single point measurement method, calibration and variability results, and a description of the products and methods used, read the Application Note: Sampling Considerations for the Measurement of a UV Stabilizer in Polymer Pellets Using FT-NIR Spectroscopy.
[…] We conducted a study involving the determination of the concentration of an ultraviolet (UV) stabilizer additive in polystyrene pellets using a FT-NIR analyzer with a sample cup spinner and discovered these seven advantages above. You can read an overview of the study and its results in: How Can You Get Accurate Results when Measuring Bulk Polymer Pellets? and How To Get Accurate Results when Measuring Bulk Polymer Pellets: The Experiment. […]