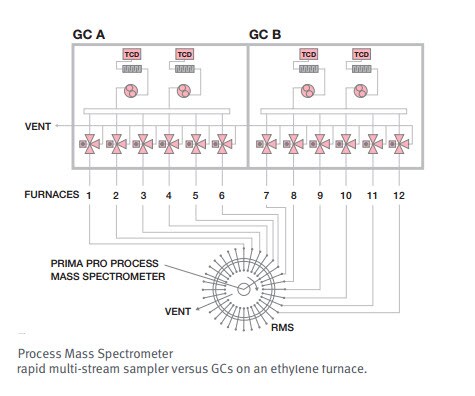
A major olefin producer investigated the comparative benefits of Gas Chromatography (GC) and Mass Spectrometry by carrying out a head-to-head evaluation of the analysis methods. A single mass spectrometer with a 32-port rapid multi-stream sampler (RMS) was compared against a process GC configured with two analytical ovens (see figure below). 12 furnaces were connected but only six were chosen for the evaluation based on their planned availability. The GC analysis time was three minutes for limited component analysis, resulting in a total cycle time of nine minutes. The mass spectrometer needs just 30 seconds for a complete analysis, resulting in a cycle time of three minutes.
The next figure contains the data produced during the evaluation. The upper 24-hour plot represents the propylene/ethylene ratio (severity) from the mass spectrometer. The lower plot represents data from the GC. A three-minute mass spectrometry analysis cycle tracked furnace dynamics while the GC was unable to do the same during its nine-minute cycle.

The GC provided average severity of 0.38 versus 0.39 which was provided by the mass spectrometer. During recalibration of the GC, the customer proved the mass spectrometer was correct. The GC missed a significant transient between 09:00 and 09:30 and was off-line from 10:00 for two hours. The test established a five-day calibration interval for the GC while the mass spectrometer remained stable and did not require recalibration for the duration of the evaluation.
Mass spectrometry was the clear winner.
For more details about the challenge, as well as how mass spectrometry can advance process control and efficiency during ethylene production, see the Process Control and Efficiency During Ethylene Production Application Note.

Maximizing ROI Through Uptime in Labs and Production Lines
Uptime Optimization is the New ROI Metric In today’s h... Germain Siraudin
Read More
K 2025: Showcasing the Future of Sustainable, Smart, and Responsible Plastics Production
This week, more than 3,000 exhibitors and 177,000 visitors f... Keith Cornell Nimesh Khadka, PhD
Read More
The Principles and Capabilities of Powder Rheology
Powder rheology is a critical analytical technique for sever...
Read More
Monitoring the UV Cure Process of a Polymer Based Ink by FT-IR
Can the degree of cure of a polymer-based ink applied to a M...
Read More
Very interesting. I highly enjoyed reading this article. Thank you much for sharing.