 FTIR spectroscopy can be used to study the dynamics of an adhesive curing process, as shown by a study we conducted using automotive adhesives. Adhesive manufacturers need this information for development of new adhesives or changes in formulation.
A small drop of a UV-cured acrylate adhesive (Dymax 6-621-GEL) was placed on the surface of a diamond ATR accessory in the sample compartment of an FT-IR spectrometer, equipped with an MCT detector to take advantage of the of the fast scan capabilities of the FT-IR spectrometer. The scan rate of the spectrometer was set to collect 13 spectra/second, to accurately monitor the rapid reaction kinetics of a UV-curing process. In this experiment, the kinetic scan was started, then the UV source turned on.
The Gram-Schmidt profile of the process was monitored over time, showing that the reaction completed in approximately thirty seconds. The Gram-Schmidt profile essentially measures change in the infrared spectrum from its initial state. [Wolfram MathWorld describes the profile as follows: “Gram-Schmidt orthogonalization, also called the Gram-Schmidt process, is a procedure which takes a nonorthogonal set of linearly independent functions and constructs an orthogonal basis over an arbitrary interval with respect to an arbitrary weighting function w(x) .”] Any change will be registered as a positive change in the Gram-Schmidt, so the Gram-Schmidt tells us that something is changing in the chemistry of the system, but not what is changing.
We observed a short incubation delay of approximately five seconds in the reaction after exposure to UV light, followed by rapid conversion of the acrylate to a methacrylate polymer.
The spectral changes that were recorded over the course of the reaction are summarized below, with the initial spectrum shown on top in blue, the midpoint spectrum in purple, the endpoint spectrum in green, and the overall differential spectrum (endpoint-startpoint) on the bottom in red.
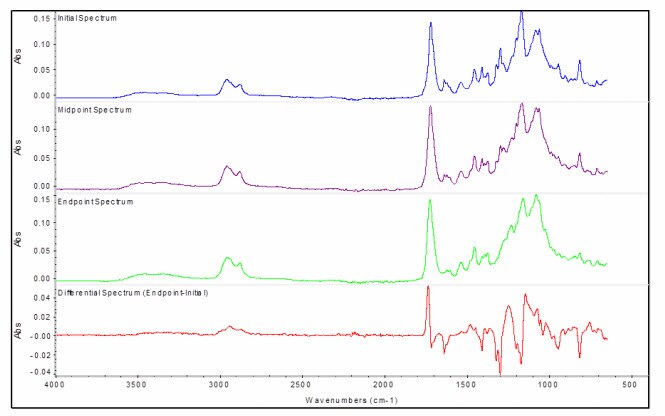
Changes in the spectra are most evident in the differential spectrum, with positive peaks produced by products in the reaction, and negative peaks produced by reactants.
To study the chemical reaction process in more detail, we defined chemigrams based on the absorbance intensity of different functional groups in the differential spectrum. A differential kinetic run was obtained by collecting the background spectrum with the uncured adhesive before starting the kinetic run, resulting in the collection of differential kinetic spectra. The adhesive cures by polymerization of the methacryate C=C bond, causing not only a decrease in that bond intensity, but also a shift in the carbonyl bond to higher frequency as the structure changes from an alkene-conjugated ester to a simple ester.
To further expand on this point, we can replay the kinetic data file like a movie, where we can see peaks growing into the differential spectrum from the baseline as the reaction proceeds. The baseline starts off at zero because the uncured adhesive single beam spectrum was set as the background, so any changes we observe over time are the changes in the spectrum as a result of the chemical reaction. In our example peaks, the positive peak was due to the carbonyl shift, and the negative peak was due to depletion of the C=C double bond, growing from the baseline over the course of the curing process.
The adhesive used in the previous example is marketed as a multi-cure adhesive, which can be cured at ambient temperature with exposure to UV light alone, or can also be thermally cured following UV exposure to complete the cure where UV light exposure may be limited, such as in complex joints.
A second curing reaction was recorded where the adhesive was exposed to only a few seconds of UV light at ambient temperature, followed by a thermal cure at 100oC for one hour using a heated ATR accessory.
The differential spectra from the two curing processes are very similar, in particular in the region of the spectrum below 1800 cm-1, leading us to conclude that the final products of both processes are the same, and the two curing processes produce equivalent curing endpoints.

As a final example of monitoring an adhesive curing reaction, we recorded the curing process of an epoxy labelled as 5-Minute Epoxy. The adhesive consists of two components, a resin and hardener, which must be thoroughly mixed prior to application. The two components were mixed, and a small drop of the adhesive was deposited on to the surface of a diamond ATR accessory.
The reaction was monitored for 30-minutes, coadding 4 scans per scanset at 4 cm-1 resolution (5 sec time resolution) using a DTGS detector.
The Gram-Schmidt profile, which records the change of the IR spectrum over time, indicated that the epoxy cured to its hold point in 7.5 minutes, followed by a much slower curing rate thereafter.
Learn more about automotive paints, coatings and adhesives on our website.

K 2025: Showcasing the Future of Sustainable, Smart, and Responsible Plastics Production
This week, more than 3,000 exhibitors and 177,000 visitors f... Keith Cornell Nimesh Khadka, PhD
Read More
Monitoring the UV Cure Process of a Polymer Based Ink by FT-IR
Can the degree of cure of a polymer-based ink applied to a M...
Read More
Advances in Analytical Technologies for Battery Manufacturing
Introduction Recent advancements in analytical technologies ... Kyle D'Silva
Read More
Battery Professionals Organization Hosts Webinar on Advanced Analytical Technologies. Here’s a Recap.
Editor’s Note: A recent webinar hosted by the Volta Fo... Kyle D'Silva
Read More
I want UV curing epoxy for encapsulating organic solar cells. Please suggest a proper item.
I reallt loved this article. The details are pretty helpful
I am going to download the webinar for sure. thanks
Thank you very much for letting us know about this. Here, very particular and uncommon information regarding the dynamics of an adhesive curing process is mentioned. As a result, I believe this is extremely beneficial to everyone. Please add more such subjects.