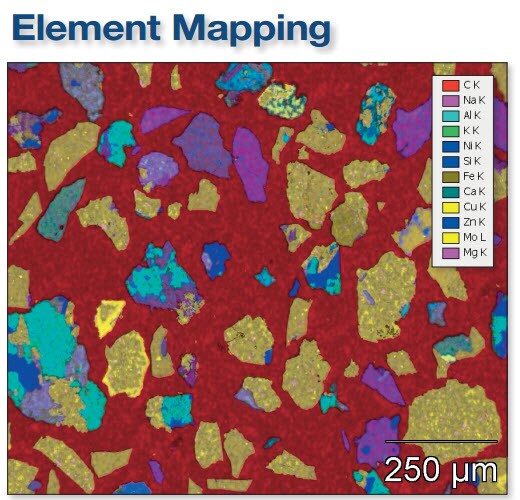
 X-ray microanalysis is a valuable technique that provides elemental and chemical information about metals and advanced metallic materials useful to manufacturers in development, production and failure analysis. The real power of X-ray microanalysis is the speed and accuracy with which it can enable true discovery, uncovering the unexpected chemical phase(s) that element-based image analysis alone cannot detect given the limitations of distilling massive amounts of spectral data into meaningful chemical composition. Such limitations prevail despite larger, higher resolution detectors and faster data capture, which provide even more data, again, without a means of extracting meaningful chemical composition. A solution, which was developed by researchers at Sandia National Laboratory, Albuquerque, New Mexico, couples elemental analysis with multivariate statistical analysis to enable true discovery. When all the data is effectively leveraged – spectral, spatial, elemental, numeric – one can draw more confident conclusions than with elemental mapping alone.
Applying the Conventional EDS Paradigm to Overcome Contemporary Challenges
While spectral mapping has long been associated with time-consuming image capture and analysis, today’s high speed, high resolution data capture – at more than 100,000 counts per second – not only speeds the data capture process, but also provides higher resolution elemental maps resulting from sophisticated spectral imaging software. Now analysts can verify what they expect and also identify discrete, unexpected elements.
However, elements rarely exist in discrete elemental states. They exist in phases – phases whose majority content often masks the presence of an important minority element despite advances in spectral imaging and mapping technology, such as deconvolution of spectral curves. Elements typically form compounds of atoms that commonly include oxides, sulfates, chlorides or alloys. Analysts can detect the base elements of such discrete elemental phases using conventional energy dispersive spectrometry (EDS). However, they are challenged with identifying the precise phase with an actionable degree of certainty. Equally challenging is ensuring that the final image, which begins as an electron image followed by point-and-shoot capture or element mapping, highlights the region of interest where the unexpected element is located – a nearly impossible task with point-and-shoot or basic element mapping alone.
The Analyst’s Challenge: Arriving at a Conclusive Answer
Most experienced researchers and analysts know what to expect when examining electron images. Hence, point-and-shoot X-ray microanalysis data capture has been sufficient at verifying that expected elements actually exist. However, given the scale and complexity of today’s materials and applications, simply verifying “reasonable expectations” may limit discovery – that is, discovering the existence and location of unexpected elements and compounds.
What is the value of finding an unexpected element? In quality control and analysis applications, the value lies in the opportunity cost of allowing a manufacturing process to continue producing parts that may eventually fail in some way. For researchers, the opportunity cost is the time lost pursuing a discovery that may not yield the anticipated results.
Read part 2 of this post (next week), in which we will explore a specific example of a more conclusive inference that can be made from a sample by conducting spectrum-focused analysis on a pixel-by-pixel basis. This can lead to rapid discovery of elemental phases that are not revealed by elemental mapping alone.


Leave a Reply