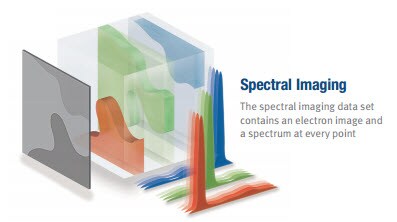
 Spectral Imaging has revolutionized X-ray microanalysis. With a complete spectrum acquired at every pixel, it is the centerpiece for all imaging, X-ray mapping, linescan, and advanced automated analysis. With one click, data can be analyzed repeatedly without the need for re-acquiring or changing acquisition parameters. Once the data is collected, it can be analyzed locally at the microscope or taken offline to a different computer for report preparation.
Spectral Imaging provides for the display of any number of element maps, both during and after the acquisition. It includes a rich set of data extraction and analysis functions for interpreting the data. Each spectrum can be used for standardless or full standards quantitative analysis. Here are four EDS mapping routines that can be used with X-ray microanalysis.
- Element Mapping
The most basic and commonly used mapping routine for EDS and WDS microanalysis is element mapping. It shows the distribution of X-ray counts for all identified elements in the acquisition. Also known as digital mapping, elements are automatically identified using a least squares fit algorithm and identified elements are displayed and/or overlaid on the electron image. This method provides a visual assessment of the spatial distribution of the elements in the sample with RGB color overlays to assess regions of interest. - Quantitative Element Mapping
The quantitative element mapping routine improves the accuracy of elemental identification for mapping by performing peak processing and matrix correction algorithms at each pixel in a spectral imaging data set. In seconds it provides quantitative information for each element it identifies, and processes the spectrum at each pixel for background subtraction, peak deconvolution, and matrix correction. Elements are automatically identified using a least squares fit algorithm and are processed for atomic%, weight%, or net counts. This method deconvolves confounding peak overlaps, eliminates the background, and provides quantitative elemental information on the entire sample at every pixel. - Elemental Phase Mapping
The elemental phase mapping routine employs a thresholding algorithm to the prior elemental mapping routine, identifying and displaying the compositional phases in the sample. The output is a quantitative analysis for each phase, which can be used to compare against a database for true phase identification. Phases are displayed independently and/or overlaid on the electron image, and can be combined with a match database to provided named phases. You can be sure that you will get the same answer, for every user, every time because the least squares fit algorithm automatically identifies the elements. - Spectral Phase Mapping with Proprietary Software
Some proprietary spectral phase mapping software can automatically inspect and compare the X-ray spectrum at each pixel. Pixels with statistically similar spectra are grouped together using a proprietary algorithm to identify the phases present in the sample so a quantitative analysis of each phase can be performed. The routine iterates until the number of pixel groups stabilizes – neither increasing nor decreasing. The software then transforms these pixel groups into unique phases which can be compared against the match database and named.The benefit of using a proprietary spectral phase mapping software is its simple use. No knowledge of sample is required, no selection of elements is required, so you get the same answer, every user, every time. Trace element identification is enhanced because true phase analysis, based on the X-ray spectra and not on elemental identification, is done.
EDS offers the easiest and most efficient methods for extracting answers from your microscope with the utmost confidence and skill and sets the foundation for mistake-free analysis. You can see the various element maps of a diverse mineralogical sample that has been analyzed to determine the elemental content in this EDS Mapping Routines document.


[…] our Advancing Mining blog, we discussed the four EDS mapping routines that can be used with microanalysis to help identify a […]