Search
Mouse intestinal section visualized using fluorescent Qdot® nanocrystal conjugates.
A mouse intestinal section visualized using fluorescent Qdot® nanocrystal conjugates. Actin was labeled with a mouse anti-actin monoclonal antibody and visualized using red-fluorescent Qdot® 655 goat F(ab′)2 anti–mouse IgG (Q11022MP, Q11221MP). Laminin was labeled with a rabbit anti-laminin polyclonal antibody and visualized using green-fluorescent Qdot® 525 goat F(ab′)2 anti–rabbit IgG (Q11441MP). Nuclei were stained with blue-fluorescent Hoechst 33342 (H1399, H3570, H21492). Image contributed by Thomas Deerinck and Mark Ellisman, The National Center for Microscopy and Imaging Research, San Diego, CA.

Related Products
Related Images
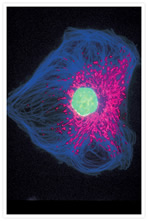
A prometaphase muntjac skin fibroblast stained with Alexa Fluor® 350 phalloidin, an anti–a-tubulin antibody and an anti–cdc6 peptide antibody. Go ›

Bovine pulmonary artery endothelial cells (BPAEC). MitoTracker® Red CMXRos, SYTOX® Green nucleic acid stain, biotin-XX goat anti–mouse IgG antibody and Cascade Blue® NeutrAvidin biotin-binding protein. Go ›
Endothelial cells. Go ›

Mouse Anti-Alpha Tubulin Monoclonal Antibody (Cat. No. A11126) Go ›

1% Agarose gel containing 16S and 23S ribosomal RNA (rRNA). SYBR® Green II RNA gel stain. Go ›

Simultaneous detection of expression of five genes in a whole mount Drosophila embryo by fluorescence in situ hybridization (FISH) with five RNA probes Go ›

Human tonsil section visualized with fluorescent Qdot® nanocrystal conjugates. Go ›

Three-color staining of HeLa cells using fluorescent Qdot® nanocrystal conjugates. Go ›
