Introducing Fragment Analysis and how it can be used for a variety of applications formerly requiring manual gels and autoradiography.
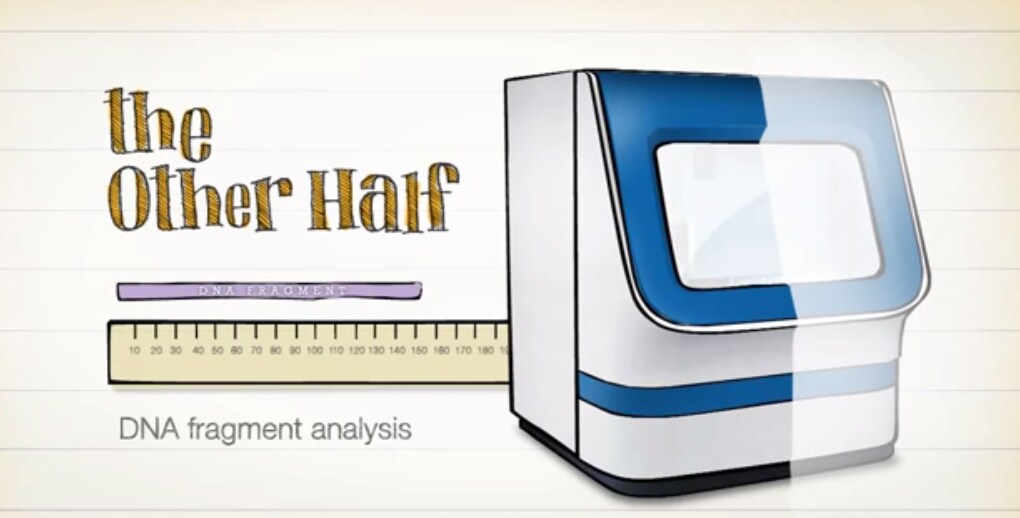
Measuring DNA lengths
In Part 1, we took a look at using Sanger dideoxy chemistry to terminate elongating DNA strands, which are then separated via capillary electrophoresis (CE) in order to obtain single-base resolution and discrimination between single-base changes in DNA length.
Here, we will examine another kind of DNA analysis using capillary electrophoresis (CE), to measure DNA fragments of varying size as the final determination, in contrast to using the fragment-size differences to elucidate sequence information.
In undergraduate biology (and increasingly at the secondary school level), students are taught how manual gel electrophoresis separates DNA molecules on the basis of length, the gel subsequently stained with ethidium bromide dye and then viewed under ultraviolet transillumination and documented by photography. The relative size of the separated molecules are determined by comparison with a known size standard ‘ladder’. What if this entire process of DNA separation and measurement were completely automated?
With a capillary electrophoresis instrument, a given DNA assay that has been labeled with the appropriate dye can quickly be sized against a molecular standard for a variety of applications. Any primer-based method that enzymatically incorporates nucleotides (whether with the PCR technique or not) can have a primer labeled with a fluorescent dye, or the nucleotides so labeled, and the resulting products separated and measured in the capillary.
Many applications
The kinds of applications for this technology are rooted in the legacy applications that once used radioactivity and X-ray film. For example, before microsatellite marker genetics were used for linkage analysis, a method called Restriction Fragment Length Polymorphism (RFLP) was first described in 1980. RFLP experiments can now be easily detected using Fragment Analysis.
Microsatellites are a major application (also called Short Tandem Repeat sequences or STRs), which are repeated units of 2 to 7 nucleotides where each allele may differ by the number of repeats. Microsatellite analysis has been widely used for linkage mapping, parentage analysis, and agricultural breeding, in addition to population genetics.
Genotyping is another popular application, and our SNaPshot™ Multiplex System uses a dideoxy-nucleotide single-base extension to determine as many as 10 nucleotide variants simultaneously.
Other applications include Amplification Fragment Length Polymorphisms (AFLP), BAC fingerprinting, Tilling (for agricultural biotechnology), and even Single-Strand Conformational Polymorphism (SSCP). All these applications look at nucleotide variation based upon changes in restriction enzyme recognition sites or variation between the designed primer sites for the PCR, and these methods sample the genetic variation without a priori knowledge of the sequence of the individual sample in question.
In order to look at deletion mutations such as loss of heterozygosity (LOH), aneuploidy or large chromosomal deletions, Quantitative Fluoresence PCR (QF-PCR) was developed to measure the fluorescent peak height across multiple samples to detect a deletion event. (Due to its haploid nature, a region of LOH will have half the relative fluorescence intensity compared to a normal diploid region.)
Analyzing DNA fragments on the basis of size means that an application that uses gel-based methods can be adapted for CE by the simple inclusion of a fluorescence-labeled primer or nucleotide. Due to its resolving power, you can multiplex many markers simultaneously with a single dye (and other additional samples with the same assay but with one of the other dyes available).
Software for fragment analysis
GeneMapper™ Software uses the .fsa files output by the CE instrument Data Collection Software, and performs automated peak detection and extrapolates the size standard information to the detected peaks. (There are four sizing models available to choose from.) Depending on the assay, the software can also call genotypes and assign quality values to the called genotypes, or determine the relative peak heights for quantitative fluorescence determination.
In addition, there are security and audit features available to assist with meeting 21 CFR Part 11 requirements, as well as customizable report-generation features.
Resources for more information
Here is more information about microsatellite marker analysis, and a PDF is also available describing the variety of microsatellite applications.
Interested in more? Visit the resource pages online:
Fragment Analysis Software – Getting Started Guides
Check out the whole Series:
Sanger Sequencing by CE 1: Foundations
Sanger Sequencing using CE 2: Fragment Analysis
Fragment Analysis using CE 3: Designing a 27-plex PCR
Sanger Sequencing by CE 4: Bioinformatics
Sanger Sequencing by CE 5: Sanger Sequencing Applications
Sanger Sequencing by CE 6: Resources

When PCR Gets Dirty – Tackling PCR Inhibitors
In this first Absolute Gene-ius: Science Snapshot episode, h...
Read More
qPCR-based fragmentomics for monitoring cancer disease progression
As fragmentomics gains momentum in cancer liquid biopsy rese... Deepak Tripathi, PhD
Read More
Multiplex vs. Singleplex qPCR: What do I need to know?
Real-time PCR (qPCR) has transformed how scientists detect a... John Pfeifer, PhD
Read More
Uncovering the Science Behind Success: SUNY CFG’s Journey testing Smart Deep Basecaller
At the Center for Functional Genomics, University at Albany,...
Read More
Leave a Reply