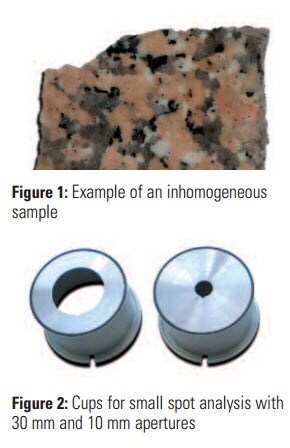
 Process control, failure troubleshooting, and in-situ identification are all now possible using a standard laboratory wavelength dispersive X-ray fluorescence (WDXRF) spectrometer with small spot/mapping capability. Traditionally, WDXRF was a technique suited for only homogeneous samples, but the latest developments in mapping and small spot functionality permit analysis of areas down to 0.5mm as well as mapping of a selected region of a sample to analyze segregations, defects or inclusions in heterogeneous samples. Coupling small spot capabilities with standardless analysis permits quantification of up to 79 elements on selected points of the sample.
Small spot analysis
Small spot analysis is a selection of one or more unique and individual points on a sample surface, each one producing a singular analysis result. In various industries such as glass and metal production, XRF instruments with spotting capability are used to analyze a small isolated area of a sample to pinpoint the source of defects. Combined with appropriate sample movement, these instruments are able to:
- Focus on specimen sections with selectable X-ray diameter of 0.5 or 1.5 mm
- Construct maps of element distributions with cartography down to 0.1 mm steps
- Study of sample homogeneity for process improvement and problem solving
The first step is for the XRF instrument to image the sample surface. From this image it is possible to click on areas of interest to designate analysis areas; for mapping the operator would select one of a number of shapes and enlarge or contract it to a size which best contains the area of interest. The sample is excited by a primary X-ray beam. The secondary X-rays emitted are collimated through an aperture which allows only the 0.5 mm area of interest excitation to continue on through the beam path to the detector.
Mapping
Mapping is the joining of adjacent individual points into a unified pattern to produce a 2 or 3 dimensional presentation along with intensity/concentration results for the selected area. This is a very helpful way of better understanding a problem. The 2D images can be viewed as individual element distributions or overlaid to give a more comprehensive correlation of the elements as a group. The 3D images are single element display and can be rotated for a full 360 degree visualization or even a birds-eye view. While most maps are collected as intensity only images, empirical calibrations can also be used to fully quantify the result.
Standardless analysis
Another useful development in XRF analytical programs is the availability of “standardless” packages. These packages allow for quantitative data to be obtained for completely unknown samples. As in many real life situations, obtaining any or enough standards to create a calibration is not always possible. This is certainly the case when analyzing defects or unknown contamination. When an approximate analysis of an inclusion or a defect in a sample is sufficient, a standardless program will provide good results without use of specific standard samples.
Comprehensive standard-less software packages are based on 64 pure element standards. Such software allows for concentration determination of unknown samples in any matrix by using complex mathematical algorithms for up to 79 elements. These algorithms correct for matrix effects as well as inter-elemental effects to provide highly accurate and precise quantitative results.
Read Small Spot Analysis: Performance in Ferrous Base to learn about a study to assess the performance of an XRF instrument analyzing a spot of only 0.5 mm a calibration using ferrous base standard samples.


Leave a Reply