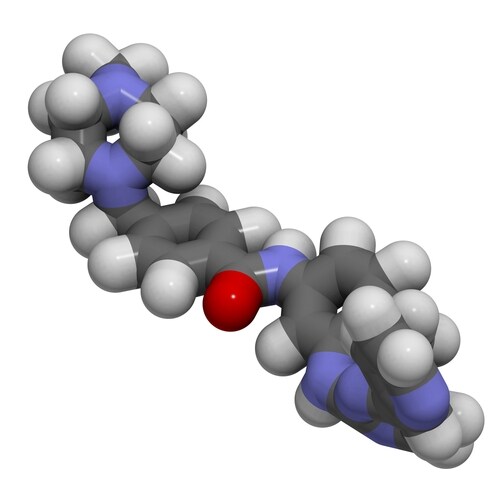
 Therapeutic monitoring of drugs is highly useful in individualizing treatment. Imatinib is a chemotherapeutic used in the treatment of chronic myeloid leukemia (CML). Therapeutic monitoring of imatinib and its metabolites results in better clinical outcomes for the patient. However, imatinib metabolization has been poorly studied. With this in mind, Friedecky et al. (2015) used high-resolution mass spectrometry (HRMS) to perform a detailed metabolite analysis in patients being treated with imatinib for CML.
They analyzed plasma samples from 37 patients treated with dosages of imatinib between 200 mg and 600 mg per day. From these, the investigators chose eight patient plasma samples from patients who were receiving a daily dose of 400 mg, collected 24 hours (plus or minus 4 hours) after their last dose. For analysis, they used a hybrid ion trap-Orbitrap system, the Orbitrap Elite mass spectrometer (Thermo Scientific), which combines a high-field Orbitrap analyzer with a dual-pressure linear ion trap. It allows parallel MS and MS analysis using various fragmentation techniques.
Friedecky et al. first analyzed a Glivec tablet, comprising 100 mg of imatinib mesylate and standard imatinib powder, which they dissolved in methanol to a concentration of 10 μg/mL. They performed analysis of imatinib in isolation to improve sensitivity by excusing potential metabolites or impurities that may arise during drug manufacture. They found several peaks corresponding to oxidation, desaturation, oxidation and desaturation, methylation, and demethylation of imatinib.
Following on from this calibration, they ran the eight plasma samples from patients receiving 400 mg per day of imatinib, which generated more than 180 unique chromatographic peaks in the range of 8.14 to 13.24 minutes. They subsequently excluded peaks that were products of ion source fragmentation and electrochemical conversion and those peaks with a very low intensity, leaving them with 90 peaks corresponding to first- and second-phase metabolites.
The investigators found that metabolic profiles were different between the plasma samples. The authors suggest that this can be influenced by liver enzymes and patient physiological and pathophysiological factors. They then used MS2 fragmentation of the phase 1 metabolites and imatinib to identify each metabolite, and MS3 fragmentation to identify phase 2 metabolites. In doing so, they characterized 74 metabolites. Due to low abundance, they found a further 16 but were unable to confirm them.
Compared to other studies, Friedecky et al. note that HRMS enabled them to identify three times the metabolites compared to other studies using lower resolution mass spectrometers.
Reference
Friedecky, D. et al. (2015) “Detailed study of imatinib metabolization using high-resolution mass spectrometry,” Journal of Chromatography A, 1409 (pp. 173–181).

New Diagnostic Biomarkers in Colorectal Cancer
Colonoscopies are currently the best method to diagnose colo...
Read More
Top-Down Proteomic Characterization of Histone H3 Proteoforms in Disease
Zheng et al. performed top-down mass spectrometric proteomic...
Read More
Effects of Rosemary Extract on Colon Cancer Cells
A team of researchers from Spain and Sweden recently ...
Read More
Lung Cancer Biomarker Discovery through Metabolic Enzyme Activity
Sun et al. (2016) present a biomarker discovery study that s...
Read More
There is no doubt that this study would boost a better understanding of chronic myeloid leukemia.