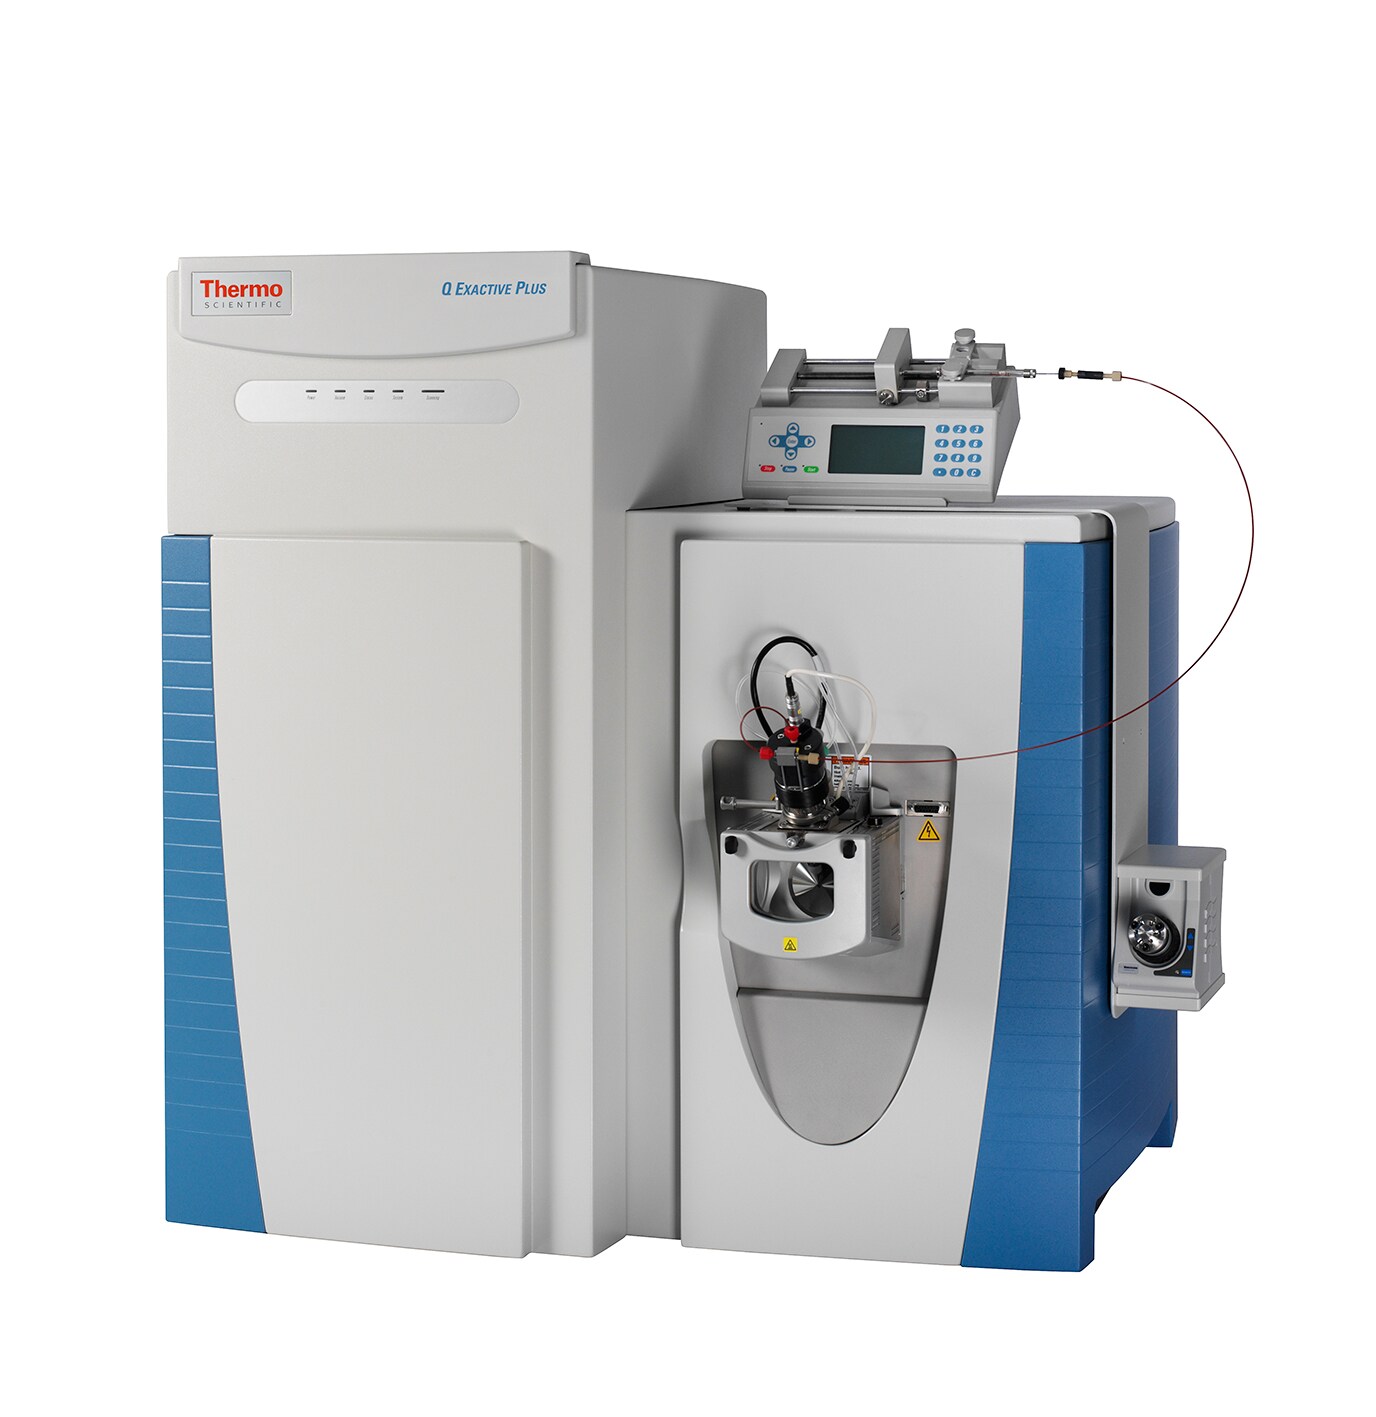
 Scientists from Thermo Scientific help take the guesswork out of isobaric tandem mass tagging (TMT) by demonstrating a workflow using a Q Exactive Plus mass spectrometer and a Q Exactive HF mass spectrometer. In an application note, Jiang et al. detail the entire mass spectrometry (MS) workflow, including sample preparation, peptide separation and MS analysis strategy.1
For their illustration, the team created an Escherichia coli digest standard and labeled it with TMTsixplex and TMT10plex TMT reagents. They mixed TMTsixplex reagents (channels 126–131) at 20:10:1:1:10:20. They also selected six reagents for the TMT10plex (channels 127C, 128N, 128C, 129N, 129C and 130N) at the same ratios.
To test the accuracy of the quantification and simulate complex samples, the scientists labeled a Pierce HeLa Protein Digest Standard, P/N 88328 (Thermo Scientific) and mixed it at 10:10:10 ratio for TMTsixplex channels 129–131 and TMT10plex channels 127N, 127C and 128N. They added the labeled HeLa cells into the E. coli sample in 1:1 ratio per channel (33 µg of HeLa digest plus 67 µg of E. coli digest). For this variation, the authors recommend using a smaller isolation width (0.7 Th). As another option, they suggest using the SPS MS3 method available on the Orbitrap Fusion Tribrid and Orbitrap Fusion Lumos Tribrid mass spectrometers.
While the instrument parameters should be chosen based on the sample, the authors offer some suggestions. For this reaction, the full MS parameters included:
- Resolving power: 70,000 (Q Exactive Plus mass spectrometer) and 120,000 (Q Exactive HF mass spectrometer)
- 3e6 AGC target
- 50 ms maximum injection time
- 375–1400 scan range (m/z)
MS2 parameters included:
- Resolving power: 35,000 (Q Exactive Plus mass spectrometer), 30,000 (Q Exactive HF mass spectrometer, TMTsixplex) and 60,000 (Q Exactive HF mass spectrometer, TMT10plex)
- AGC target 1e5
- 100 ms maximum injection time
- 0.7 or 1.2 isolation width
- 32 normalized collision energy
- 10 or 15 loop count
- 100 first fixed mass
- 2% underfill ratio
- 2–7 charge state recognition
- Peptide match: preferred
- 30 s dynamic exclusion
The team maintains that high sensitivity and quantification accuracy are achievable with longer gradients, longer columns and higher sample loads. They stress it is also important to match the correct MS2 resolution settings for different TMT tags while increasing the AGC MS2 targets based on number of tags (up to 1e5 for TMT10plex). Investigators should also match the maximum injection time with the resolving power. Additional suggestions by the authors include using a higher normalized collision energy setting without over-fragmenting the peptides and a narrower precursor isolation width on the quadrupole compared to the traditional method optimized for shotgun sequencing application.
Turning to the MS analysis, the team used Proteome Discoverer software version 2.1. The researchers note that this version is specifically designed with TMT tagging in mind. It contains a new user interface for adding reporter ion isotopic distributions that can account for reporter ion isotopic impurities for TMT10plex reagents. It can also be used to quantify proteins and peptides based on the the sum of S/N values and features enhanced normalization and scaling for peptide and protein abundance values.
Reference
1. Jiang, X., et al. (2016) “TMT workflow on the Q Exactive series – Instrument parameter optimization and data analysis in Proteome Discoverer 2.1 software, Application Note 649.” Thermo Scientific.
Post Author: Emily Humphreys. Emily has previous research experience in eye development, infectious diseases, and aging. Emily has been a regular contributor to Accelerating Science since 2012.


Leave a Reply