Read the hPSC Scorecard™ assay result

-
Sample Name – To edit the Sample Name see Edit projects.
-
Scorecard Result – The result icons
 ,
,
 , or
, or
 (positive, borderline, or negative for the sample type tested) are displayed color coded to the test type (below). The pass/fail thresholds in the
hPSC
Scorecard™ Analysis Software are set by comparing the distributions of undifferentiated and Day 5 EB samples for the 13 pluripotent stem cell lines in the reference set. A "positive" result icon for self-renewal (previously labeled pluripotent) indicates that the gene expression levels of the self-renewal markers for that sample match or exceed that of the undifferentiated reference set. A "negative" result means the expression levels are lower than the undifferentiated reference set. Failure of the self-renewal test does not necessarily imply that your cell line is not pluripotent. It means only that the levels of self-renewal gene expression in your sample are lower than the
hPSC
Scorecard™ Assay reference set.
(positive, borderline, or negative for the sample type tested) are displayed color coded to the test type (below). The pass/fail thresholds in the
hPSC
Scorecard™ Analysis Software are set by comparing the distributions of undifferentiated and Day 5 EB samples for the 13 pluripotent stem cell lines in the reference set. A "positive" result icon for self-renewal (previously labeled pluripotent) indicates that the gene expression levels of the self-renewal markers for that sample match or exceed that of the undifferentiated reference set. A "negative" result means the expression levels are lower than the undifferentiated reference set. Failure of the self-renewal test does not necessarily imply that your cell line is not pluripotent. It means only that the levels of self-renewal gene expression in your sample are lower than the
hPSC
Scorecard™ Assay reference set.
A "positive" result for any of the three germ layers indicates that the gene expression profile of those markers has a high probability of matching or exceeding that of the Day 5 EB samples derived from the 13 reference lines. A "negative" result for any of the three germ layers means that the expression profile for that gene set more closely matches that of the undifferentiated reference set than the Day 5 EB samples used to set the result thresholds.
-
Borderline result: Scores that lie very near the intersection of the undifferentiated and EB populations are now labeled "borderline" to emphasize that the result is as likely to match the scores range for the undifferentiated reference set as it is to match the scores range for the EB reference set. The gene expression profiles of these two populations are not completely distinct, so the tails of the two distributions show varying amounts of overlap, depending on the gene set.
-
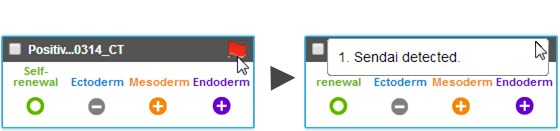
Red Flag Warning – The hPSC Scorecard™ Analysis Software performs a set of quality control checks upon data import to ensure the quality of the results. A red flag
 appears to provide additional information about a sample.
Warning messages and their meaning:
-
Well produced very low or no fluorescence
The sample is excluded from analysis and should be repeated.
-
The expression levels of internal positive control genes were low. Results will be displayed, however, sample should be repeated.
-
The expression levels of internal positive control genes were high. Results will be displayed, however, sample should be repeated.
-
Abnormal control gene expression
The expression levels of internal positive control genes were mixed. Results will be displayed, however, sample should be repeated.
-
Passive reference signal is abnormal
The passive reference signal may not be acceptable for normalization of the target signal. This may explain why a particular assay is not showing the anticipated gene expression level.
-
The hPSC Scorecard™ panel includes a control to look for Sendai virus expression. Samples are flagged if a Ct value of <30 is observed for this control. Rarely, the SEV oligonucleotide cross-reacts with other genes resulting in a false positive in differentiated cells. You may want to repeat the sample or look at the amplification plot (TaqMan® hPSC Scorecard™ Panel 96-well plate: well B9; in the 384-well plate format: wells D3, D9, D15, and D21) to see if the automated Ct value call is real, or in error.
-
Many wells containing endoderm gene expression values are undetermined and/or omitted. For best results, samples should be repeated.
-
Many wells containing mesoderm gene expression values are undetermined and/or omitted. For best results, samples should be repeated.
-
Many wells containing ectoderm gene expression values are undetermined and/or omitted. For best results, samples should be repeated.
-
Many wells containing self-renewal gene expression values are undetermined and/or omitted. For best results, samples should be repeated.
-
Insufficient data for analysis
The hPSC Scorecard™ Analysis Software requires that a minimum number of genes amplify to accurately analyze the data. In cases where less than the minimum number of genes amplify, or if data has been omitted by the user, the sample is excluded from analysis. The sample should be repeated.
-
-
Show/Hide all details – Click Hide all details
 to collapse the scorecard view. Click on the
Show all details
icon
to collapse the scorecard view. Click on the
Show all details
icon
 , to expand the scorecards for more detail. See
Expanded Scorecard Results for more information. Scorecards display in show all details view by default.
, to expand the scorecards for more detail. See
Expanded Scorecard Results for more information. Scorecards display in show all details view by default.