Assay QC plots
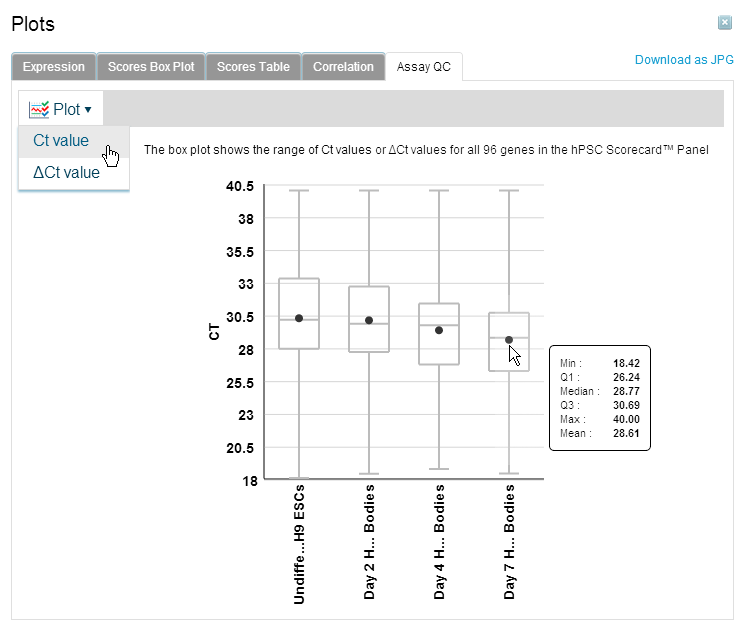
For best resolution we recommend you select from 2–12 samples to be plotted at one time. The hPSC Scorecard™ software limits the Assay QC plot output to a maximum of 12 samples. Assay QC plots of Ct or ΔCt values can be displayed.
-
Hover over each box plot to display the range of Ct or ΔCt values for that sample.
-
To switch between correlation plots of Ct or ΔCt values, click on the Plot button
 , then select Ct or
ΔCt from the
Plot drop-down list.
, then select Ct or
ΔCt from the
Plot drop-down list.
-
(Optional) Click Download as JPG to save a .jpeg file of the output for your records or for submission as a manuscript figure.