Search
End Labeling RNA for Structural Analysis
The final folded structure of an RNA dictates its association with the cellular machinery involved in processes such as transcription, translation, and splicing, and therefore is crucial for its functional role in cellular processes. In order to more completely understand how structure controls function, RNA structural analysis is done to:
- Evaluate of the footprint of a protein on an RNA
- Deduce the secondary or tertiary structure of an RNA during gene regulation or RNA catalysis
- Identify bases recognized by the cellular machinery, or other RNA-binding molecules
The above analyses require that RNA be end-labeled. RNA molecules can be end-labeled at the 5' end with T4 polynucleotide kinase or at the 3' end with T4 RNA ligase. In many experiments to deduce RNA structure, a small portion of the labeled RNA is either partially hydrolyzed to obtain a single-base nucleotide ladder or is treated with RNase T1 under denaturing conditions to cleave the RNA at G-residues which yields G ladder. RNA ladders are required to align the cleavage patterns with the RNA sequence. For structural analysis, labeled RNA can be treated with chemical or enzymatic reagents after proteins or other RNA binding molecules are bound to the RNA, or after the RNA is allowed to fold under the study conditions.
Ambion offers two products for the preparation of high specific activity end-labeled probes for RNA structural assessment: KinaseMax™ 5' End Labeling Kit, and T4 RNA Ligase, an enzyme that can add labeled nucleotides to the 3' end of RNA. The KinaseMax Kit contains Calf Intestinal Phosphatase (CIP) and associated buffers for removal of terminal phosphates from RNA or DNA prior to labeling. A novel phosphatase removal reagent ensures elimination of CIP without organic extractions and minimizes loss of nucleic acids. The subsequent kinase reaction with T4 polynucleotide kinase in the supplied kinase buffer leads to very efficient 5' end labeling of RNA or DNA. Ambion also offers T4 RNA ligase in two sizes for 3' end labeling of the RNA.
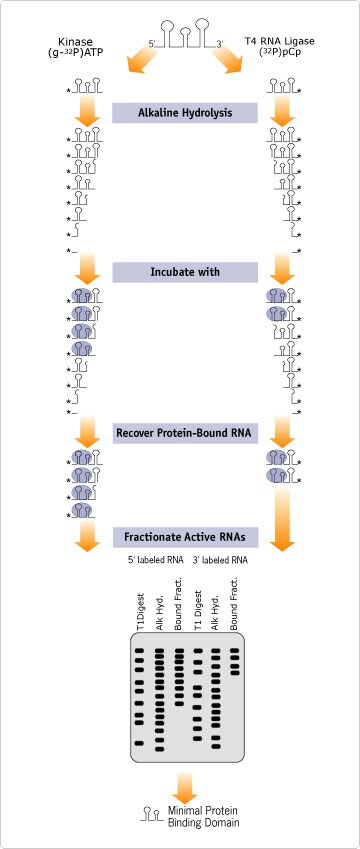 Figure 1. Boundary Experiment Schematic. Mapping Protein Binding Regions and Catalytic Activity.
Ambion offers two products for the preparation of high specific activity end-labeled probes for RNA structural assessment: KinaseMax™ 5' End Labeling Kit, and T4 RNA Ligase, an enzyme that can add labeled nucleotides to the 3' end of RNA. The KinaseMax Kit contains Calf Intestinal Phosphatase (CIP) and associated buffers for removal of terminal phosphates from RNA or DNA prior to labeling. A novel phosphatase removal reagent ensures elimination of CIP without organic extractions and minimizes loss of nucleic acids. The subsequent kinase reaction with T4 polynucleotide kinase in the supplied kinase buffer leads to very efficient 5' end labeling of RNA or DNA. Ambion also offers T4 RNA ligase in two sizes for 3' end labeling of the RNA.