Search
microRNAs As Potential Diagnostic and Prognostic Markers of Disease
E. Labourier, J. Shingara, J. Shelton, P. Powers, I. Wolf, K. Jeffers, R. Conrad and D. Brown
Summary
microRNAs (miRNAs) are small, siRNA-like molecules encoded in the genomes of plants and animals that regulate the expression of genes by binding and modulating the translation of specific mRNAs. Several published reports have shown that the expression levels of some miRNAs are reduced in chronic lymphocytic leukemia, colonic adenocarcinoma, and Burkitt’s lymphoma samples providing possible links between miRNAs and cancer.
We developed methods for isolating and quantifying all of the known miRNAs in tissue samples. We have used these procedures to analyze 25 normal human tissues, and 20 tumor and normal adjacent tissues from patients with lung, colon, breast, bladder or thyroid cancer. Each tumor type can be readily distinguished from the accompanying normal samples based on the expression levels of 3-10 miRNAs. While each different tumor type is characterized by its own unique miRNA profile, it is interesting to note that several miRNAs appear to be up- or down-regulated in almost all tumor samples relative to normal adjacent tissue. This suggests that specific miRNAs might play roles in tumor suppression. Putative mRNA targets for a number of these miRNAs are known oncogenes providing a potential link with oncogenesis.
Procedure Overview
- Fractions containing RNA species smaller than 30 nt are isolated from FirstChoice® total RNA samples by a rapid, column gel-electrophoresis method.
- microRNAs are 3’ labeled with poly(A) polymerase (PAP), amino-allyl UTP and Cy-3 or Cy-5 dyes.
- Labeled microRNAs are hybridized on glass-slide microarrays carrying DNA oligonucleotides probes specific for each known microRNA.
Array Reproducibility
- microRNA profiles in human colon vs prostate were compared in 6 independent array experiments.
- Standard deviation of Log Ratio between 6 replicates was determined for each microRNA (left graph, below). Average correlation was 98%.
- Distribution of Log Ratio for the 6 replicates was centered and normal-like (right graph, below).
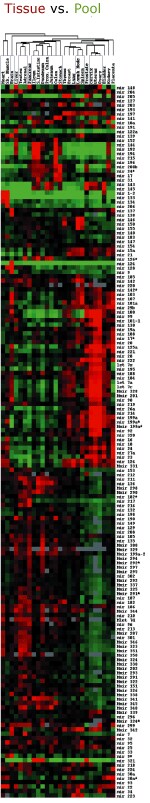
Human Normal Tissue Analysis
- microRNA fractions were isolated from 25 different human tissues or from a pool sample containing equal amount of total RNA from each tissue.
- microRNA profile in each tissue was compared to the pool microRNA population.
- Tissue and microRNA profiles were sorted based on microRNA expression levels across all tissues using hierarchical clustering (figure at left).
Data Validation
Variations of microRNA expression levels in 10 randomly picked total RNA samples were confirmed by independent detection methods (see below). Expression profiles similar to the array results were obtained by Northern blot or solution hybridization with the mirVana™ miRNA Detection Kit. 5.8 and 5S rRNAs were used as loading controls. 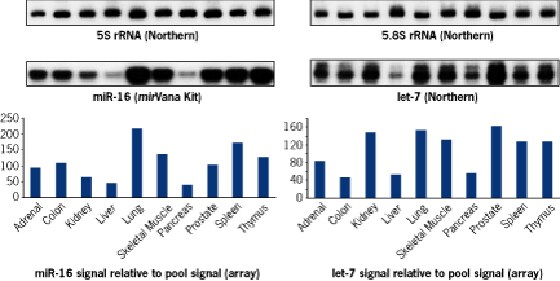
microRNAs Expressed in Specific Tissues
The table below presents examples of miRNAs whose expression is higher than the pool sample in specific tissues, and their potential target mRNAs according to Lewis et al. (Cell 2003, 115:787-798). Genes with a known function associated with the corresponding tissue(s) are in red.
| MiRNA | Tissue Where Up | Proposed Target Genes |
|---|---|---|
| miR-124 | Brain | Anglopolten-1 Precursor (ANG-1), Phox1, Lipin1, TNF-a factor |
| miR-9 | Brain | MAP Kinase Kinase Kinase 3, LDL Receptor Adaptor protein |
| miR-131 | Brain | Zinc Finger Protein 292 |
| miR-138 | Brain | GPCR kinase Interactor-1, Forkhead-Related TX Factor 3 |
| miR-7 | Brain, Adrenal Gland | Spermatogenesis-Assoc'd Factor 2, Kruppel-Like Factor 4 |
| miR-128 | Brain, Sk, Muscle | Retinally Abundant GPCR, Garab-Related GPCR |
| miR-206 | Sk, Muscle | Cartilage Homeoprotein, Gap-Junction Alpha1 (Heart Protein) |
| miR 1-2 | Heart*, Sk, Muscle | G6PD |
| miR-133 | Heart, Sk, Muscle | Ser/Thre Phosphatase 2A |
| miR-134 | Heart, Sk, Muscle | ND |
| miR-122 | Liver | Sodium Channel Subunit 3 |
| miR-152 | colon, Liver | ND |
| miR-215 | Colon, Sm, Intestine,Ileum | ND |
| miR-341 | Ileum, Sm Intestine, Prox, colon | ND |
| miR-321 | Colon, Sm Intestine, Prostate | ND |
| miR-143 | Prostate, Colon | ATP-sensitive potassium channel protein, MAPK 7 |
| miR-143 | Prostate, Colon | Pleomorphic adenoma-like protein 2, FLI-1 proto-oncogene |
| miR-145 | Prostate, Colon | ND |
| miR-17 | Colon, Stomach | ND |
| miR-24 | Stomach | G-Protein 1, syntaxin 5 |
| miR-191 | Placenta | ND |
| miR-224 | Placenta | ND |
| miR137 | Placenta, Brain | Tyrosine Kinase Receptor EHK-3 |
| miR-98 | Cervix, Uterus, Brain | ND |
| miR-130 | Cervix, Uterus | MECP2, LDL Receptor |
| miR-99 | Cervix, Uterus | ND |
| miR-195 | Cervix, Uterus | Rho GTPase Activating Protein 9 |
| miR-26a | Cervix, Uterus | KRUPPEL_LIKE ZINC FINGER PROTEIN GLIS2 |
| miR-320 | Cervix, Uterus | ND |
| miR-28 | Cervix, Uterus | ND |
| miR-142 | Lymph Node | RCAS1 |
| miR-34 | Lymph Node | Notch-1 |
| miR-216 | Pancreas | Potassium Inwardly rectifying channel J14, Shank-2 |
| miR-217 | Pancreas | ND |
| miR-30a | Kidney, Placenta | RAR-Gamma-1, Homeobox Lim-1 |
Human Tumor/NAT Analysis
- microRNA fractions were isolated from 20 different human tumors and from their corresponding normal adjacent tissues (NAT)
- microRNA expression profiles were determined for each Tumor/NAT pair
- microRNAs were sorted based on similar expression level across Tumor/NAT pairs using hierarchical clustering (below left)
Data Validation
Variation of specific microRNA expression levels in tumor samples was confirmed by independent detection methods. Variations similar to the array results were obtained by Northern blot (let-7) or solution hybridization (miR-16, 21, 143 and 145) (upper middle and right panels below). 5S rRNA was used as a loading control. 
Conclusion
- DNA oligonucleotides arrays allow for high throughput microRNA expression profiling.
- Many microRNAs exhibit organ-enriched or organ-specific expression in normal human tissues.
- Human tumor tissues are characterized by unique microRNA expression profiles.
- Specific microRNAs are up- or down-regulated in solid tumors relative to normal adjacent tissues.
- These results suggest a function for microRNAs in developmental and physiological pathways within normal tissues and in oncogenesis.