Search
Probes for Mitochondrial Morphology and Function
In addition to energy production, mitochondria help to regulate a wide range of cellular processes and functions. We offer an array of products for studying the diverse role of mitochondria in various cellular pathways and diseases. Described here are probes for mitochondrial morphology, membrane potential, calcium flux, and autophagy.Visualizing Mitochondria
Mitochondrial morphology is highly variable. This organelle can switch between a fragmented morphology, with many ovoid-shaped mitochondria, and a reticulum, in which the mitochondrion is a single, many-branched structure [1,2]. The number of mitochondria is a function of several variables, including cell type, cell-cycle and differentiation stage, cellular energy level, and overall cell health. The simple act of staining mitochondria and visualizing their morphology can provide a significant amount of information regarding their overall biology and functional state.
Antibodies to the oxidative phosphorylation (OxPhos) complexes can be used to visualize mitochondria when used in conjunction with fluorescent secondary antibodies. We offer a number of well-characterized antibodies against different proteins and epitopes within the OxPhos complexes (Figure 1). These OxPhos-specific antibodies are versatile tools for investigating mitochondrial morphogenesis, as well as for characterizing degenerative diseases such as Alzheimer’s disease and Parkinson’s disease that are associated with defects in mitochondrial function.
As with the OxPhos-specific antibodies, the CellLight® Mitochondria-GFP and -RFP reagents localize to the mitochondria independent of mitochondrial membrane potential (Figures 2 and 3). Useful for both live-cell imaging and fixed-cell analyses, these CellLight® reagents are prepackaged BacMam expression vectors encoding a fluorescent protein (GFP or RFP) fused to the leader sequence of the mitochondrial protein E1α–pyruvate dehydrogenase. BacMam reagents enable titratable and reproducible expression and high cotransduction efficiency, and they are compatible with many cell types, including those traditionally difficult to transfect such as primary neurons and stem cells.
We also offer a range of mitochondrion-selective dyes with which to monitor mitochondrial morphology and function. The uptake of mitochondrion-selective dyes is dependent on the mitochondrial membrane potential. These dyes thereby enable researchers to probe mitochondrial activity, localization, and abundance, as well as to monitor changes in membrane potential in response to pharmacological agents that alter mitochondrial function. Conventional stains such as rhodamine 123 and tetramethylrhodamine methyl ester (TMRM) are not maintained in the mitochondrion once its membrane potential is lost, limiting their use in experiments in which cells are subsequently fixed and permeabilized or treated with agents that affect their energetic state. MitoTracker® Green FM, Orange CMTMRos, Red CMXRos, and Deep Red FM probes overcome these limitations. Like conventional stains, the MitoTracker® probes are sequestered by functioning mitochondria; however, cells stained with these dyes retain their fluorescent staining patterns during subsequent fixation and permeabilization steps. Fluorescent detection reagents for visualizing mitochondria are summarized in Table 1.
)
Figure 1. Major protein complexes of the oxidative phosphorylation (OxPhos) system, and antibodies (catalog numbers) that recognize them. (click to enlarge)
Table 1. Fluorescent detection reagents for imaging mitochondria.
| Organic dyes (e.g., MitoTracker®, JC-1, and TMRM dyes) | BacMam-based fluorescent proteins (e.g., CellLight® reagents) | Antibodies | |
|---|---|---|---|
| How they work | Positively charged dyes localize to actively respiring mitochondria. | Combine targeting sequence–fluorescent protein fusion with the transduction efficiency of BacMam to label organelles independently of function (i.e., pH, mitochondrial membrane potential). | Recognize specific protein target of interest (e.g., anti–OxPhos complex IV). |
| Applications | Live-cell imaging applications; some reagents are fixable,* thus compatible with antibody-based imaging applications. | Live-cell imaging applications; fixable,*† thus compatible with antibody-based imaging applications. | Imaging fixed cells or tissue. Compatible with MitoTracker® and CellLight® reagents. |
| Typical workflow | Incubate cells with the reagent for approximately 5–30 min. Dye-specific working concentrations and incubation times are provided in the product’s manual. | The ready-to-use CellLight® reagent is added to live cells, followed by an overnight incubation to allow for protein expression. | Cells are fixed and permeabilized, incubated with the antibody for labeling, and visualized with a fluorescently labeled secondary antibody.** |
| * Please consult the product manual or contact technical service for additional information on the fixability of these reagents. † With fluorescent protein constructs, anti-GFP or anti-RFP antibodies can be used to amplify or change the fluorescence signal output. ** Secondary antibody is required if the primary antibody is not directly labeled. | |||
Determining Mitochondrial Membrane Potential
Many of the reagents for visualizing mitochondrial morphology are also useful for detecting mitochondrial membrane potential, and thus for monitoring the effects of disease states or pharmacological agents that alter mitochondrial function (Figure 2). These reagents include rhodamine 123 and TMRM—reversible probes that exhibit a change in fluorescence intensity in response to a change in mitochondrial membrane potential—and MitoTracker® dyes, which accumulate in active mitochondria in response to membrane potential.
The fluorescent probe JC-1 is a dual-emission potential-sensitive reagent. At low membrane potential, this dye exists as a green-fluorescent monomer; at higher potentials, JC-1 forms red-fluorescent “J-aggregates”. The ratio of red to green JC-1 fluorescence provides a measure of membrane potential that is independent of mitochondrial size and density, factors that may influence measurements with single-emission probes. Dual-emission measurements can also be achieved by using a combination of the potential-insensitive CellLight® Mitochondria-GFP reagent and a potential-sensitive probe such as TMRM [3], allowing simultaneous visualization of mitochondrial morphology and membrane potential (Figure 2).
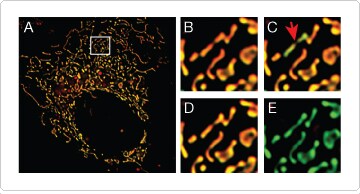
Figure 2. Dynamic imaging of mitochondrial membrane potential. HeLa cells were transduced with CellLight® Mitochondria-GFP and loaded with 50 nM TMRM for 10 min at 37°C. (A–E) Images were acquired at 5 sec intervals for 90 sec following treatment with the uncoupler CCCP; zoomed sections B–D reveal heterogeneity in mitochondrial membrane potential regulation. Transient depolarization was observed in one but not all mitochondria (C, arrow), as indicated by loss of orange TMRM signal; GFP fluorescence was maintained during depolarization, indicating an intact mitochondrion. Loss of mitochondrial membrane potential was evident by 90 sec post-CCCP treatment (E); however, mitochondria were still intact, information that would have been lost using TMRM alone.
Detecting Mitochondrial Calcium Flux
Mitochondria play a vital role in maintaining intracellular calcium homeostasis. The positively charged calcium indicator rhod-2 AM has long been used to measure mitochondrial calcium flux because of its preferential accumulation in mitochondria. A limitation of using rhod-2 alone is that mitochondria are only visible after calcium uptake; however, determining mitochondrial location before the sequestration of calcium can provide information about the positioning of individual mitochondria with respect to spatially localized intracellular calcium release.
For more informative measurements of calcium flux in individual mitochondria, rhod-2 AM can be combined with potential-independent mitochondrial markers such as CellLight® Mitochondria-GFP, which allow observation of mitochondrial fission, fusion, and motility before, during, and after calcium uptake. Pairing the green-fluorescent CellLight® Mitochondria-GFP with the red-orange–fluorescent rhod-2 allows the spatial and temporal aspects of calcium sequestration to be analyzed in the mitochondria within a cell (Figure 3) and across a cell population.
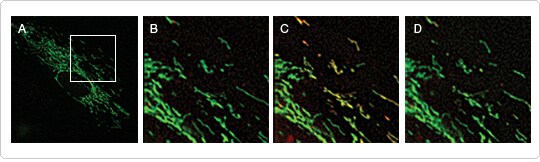
Figure 3. Imaging mitochondrial calcium levels and dynamics. (A) HeLa cells were labeled with CellLight® Mitochondria-GFP and treated with 5 µM rhod-2 AM for 15 min at 37°C before imaging live over 100 sec. (B–D) The region outlined in (A) is enlarged to show individual mitochondria within a single cell over time. (C,D) Calcium is released from internal stores following application of 10 µM histamine. Mitochondria in close proximity to the calcium release are revealed by the increase in the orange-red fluorescence of rhod-2. The arrow in (C) denotes a mitochondrion that may have impaired calcium uptake, a detail that would have been missed using rhod-2 AM alone. The asterisk marks a mitochondrion that shows a transient elevation in calcium levels.
Imaging mitochondrial autophagy
Old, damaged, or surplus mitochondria are major targets for autophagy, which in this case is referred to as mitophagy. Degradation of mitochondria through this process can be used to recycle their amino acids and other nutrients, as well as to remove damaged mitochondria from the cell. The protein LC3B, which plays a critical role in autophagy, can serve as a general marker for autophagic membranes [4,5]. Many of the live-cell reagents described earlier for visualizing mitochondria can be used in combination with the Premo™ Autophagy Sensors LC3B-GFP and LC3B-RFP to observe mitophagy (Figure 4).
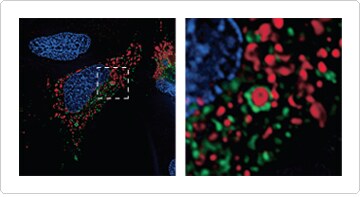
Figure 4. Imaging mitochondrial autophagy in live HeLa cells. Cells were transduced with CellLight® Mitochondria-RFP and Premo™ Autophagy Sensor LC3B-GFP. Following treatment with 200 μM chloroquine and 10 μM CCCP, nuclei were stained with Hoechst 33342. The region outlined in (A) is enlarged in (B) and clearly shows engulfment of a mitochondrion (red) by a LC3B-positive autophagosome (green).
Exploring Mitochondrial Structure and Function
We offer a variety of unique Molecular Probes® reagents and stains for selectively labeling mitochondria in fixed or live cells, for monitoring mitochondrial structure and function, and for studying reactive oxygen species, a key component of mitochondrial biology and physiology.
References
- Koopman WJ, Visch HJ, Smeitink JA et al. (2006) Cytometry A 69:1–12.
- Duvezin-Caubet S, Jagasia R, Wagener J et al. (2006) J Biol Chem 281:37972–37979.
- Distelmaier F, Koopman WJ, Testa ER et al. (2008) Cytometry A 73:129–138.
- Dagda RK, Zhu J, Kulich SM et al. (2008) Autophagy 4:770–782.
- Du L, Hickey RW, Bayir H et al. (2009) J Biol Chem 284:2383–2396.
For Research Use Only. Not intended for any animal or human therapeutic or diagnostic use.
For Research Use Only. Not for use in diagnostic procedures.
More Information
See all Mitochondrial Biology Products
Download This Article
Get a copy of this article as it appears in the print version of BioProbes 64.
Quick Product View
See a complete listing of the products discussed in this article.
