Search
Advances in High-Content Screening
Advances in software, hardware, and automation have allowed cellular imaging to expand into higher-throughput applications, often referred to as high-content screening (HCS) or automated imaging. HCS permits highly parallel analysis of multiple cellular parameters, and has greatly facilitated efforts in the drug discovery field. We have applied our extensive expertise in fluorescent labeling technologies and cell-based assays to create solutions tailored to the specific requirements of HCS, including assays for cell viability, DNA damage, mitotoxicity, autophagy, apoptosis, and cell proliferation.HCS: A Rapidly Expanding Technology
Much of the original excitement around HCS was related to the immense throughput and data quantity enabled by advances in instrumentation, robotics, image analysis software, and data storage and management strategies. These technologies made it possible to screen tens of thousands of wells in a single day, and while not yet approaching the speeds of high-throughput screening methods, it had nonetheless become feasible to perform HCS screening campaigns of libraries with several hundred thousand compounds. Today, interest in HCS is generated by the prospects of using physiologically relevant cell models (primary and stem cells, complex co-cultures of live cells, and three-dimensional cell models), real-time analysis, user-friendly image analysis software and ready-to-use application packages, and less expensive instruments that make the technology accessible to more researchers.
Many of the probes originally developed for fluorescent microscope– based imaging or flow cytometry are now being used in HCS applications: Alexa Fluor® dye–labeled secondary antibodies and phalloidin conjugates, DNA stains, MitoTracker®, LysoTracker®, and ER-Tracker™ organelle markers, and a variety of probes for cellular function. Examples of these applications include measurement of drug response signatures in individual cancer cells [1] (Figure 1), regulation [2] and induction [3] of autophagy, and analysis of substrate phosphorylation following treatment of cells with a small-molecule Aurora kinase inhibitor in preclinical testing [4].
We have also developed assays and kits validated specifically for HCS. These kits are designed to help address inherently complex biological problems through the use of spectrally matched fluorophores for optimal results in multiparametric assays. These kits for DNA damage, mitotic index, general viability, and other cytotoxicity-related assays have been validated across multiple platforms and cell types.
More Information
- Learn More About High-Content Screening
Download This Article
Get a copy of this article as it appears in the print version of BioProbes 65.
Quick Product View
See a complete listing of the products discussed in this article.
View Products

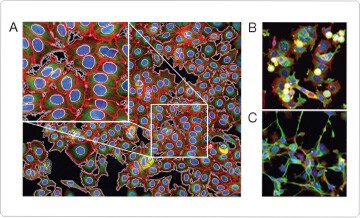 Figure 1. High-content imaging of cytoskeletal and nuclear architecture in breast cancer cells. Example images are shown from a multiplex assay to profile drug response phenotypes across distinct cancer cells using DAPI (nucleus; blue), Alexa Fluor® 568 phalloidin (actin; red), anti–β-tubulin antibody detected with Alexa Fluor® 488 donkey anti–mouse IgG antibody (microtubules; green), and HCS CellMask™ Deep Red stain for cellular demarcation. (A) MCF7-wt control cells (DMSO-treated) showing the segmentation of nuclear and cytoplasmic boundaries created by the image analysis software. The inset shows a zoomed region. (B) MCF7-wt cells treated with 1 μM vincristine for 24 hr. (C) MCF7-wt cells treated with 3 nM staurosporine for 24 hr. Images were acquired on the automated ImageXpress 5000A high-content imaging platform (Molecular Devices). Image analysis was performed with custom-designed algorithms created using Definiens Cellenger cognition network software. Images were contributed by Peter Caie, Advanced Science and Technology Laboratory, AstraZeneca. The full study was published in Mol Cancer Ther 9:1913–1926.
Nuclear and Cytoplasmic Image Segmentation
Image segmentation, a key aspect of HCS assays and the first step of automated image acquisition and analysis, involves separating objects of interest (cells) from background or other features not relevant to the analysis and allows demarcation of cells in their appropriate spatial context.
With the HCS NuclearMask™ stains, fluorescently stained nuclei are detected and then extrapolated by the image analysis software to build a mask that marks the probable position of the cytoplasmic region. In contrast, cellular demarcation with HCS CellMask™ stains enables automated image analysis software to determine where the cytoplasm of one cell ends and another begins, a parameter that cannot be measured accurately with a nuclear counterstain alone. The HCS CellMask™ and NuclearMask™ segmentation tools are available in a range of colors for easy combination with other assay components and minimal bleedthrough into adjacent channels.
Cell Viability
The HCS LIVE/DEAD® Green Kit measures cytotoxicity through the use of the Image-iT® DEAD Green™ viability stain, a nonfluorescent and cell-impermeant compound that exhibits strong fluorescence enhancement upon binding to DNA. Cytotoxic compounds can potentially increase plasma membrane permeability, allowing entry of the Image-iT® DEAD Green™ viability stain. This two-color fluorescence assay also includes a cell-permeant nuclear segmentation tool that stains both live and dead cells, reflecting the total cell number. For total cell staining, the kit includes both blue-fluorescent Hoechst 33342 and near-infrared–fluorescent HCS NuclearMask™ Deep Red reagent. Both of these segmentation stains survive fixation and can be used with the Image-iT® DEAD Green™ viability stain for excellent discrimination of live and dead cells.
DNA Damage and Cytotoxicity
The HCS DNA Damage kit quantitatively measures two important cell health parameters: DNA damage and cytotoxicity. DNA damage is detected using an antibody against phosphorylated H2AX (Ser139), which is induced in response to double-strand breaks. The membrane-impermanent Image-iT® DEAD Green™ viability dye indicates cytotoxicity by only staining dying cells in which the membrane is permeabilized, allowing the dye to enter. Both indicators are amenable to fixation and permeabilization, thus allowing for multiplexing with other biomarkers of interest. Hoechst 33342, which stains DNA in both live and dead cells, is included in the kit as a nuclear segmentation tool.
Hepatotoxicity
Hepatotoxicity is one of the major causes of drug attrition in preclinical and clinical development. Implementation of cell-based multiparametric assays for hepatotoxicity early in the discovery process offers the potential to identify toxic compounds before proceeding to more costly animal studies. To support this approach, we have developed and validated high-content assays for use in hepatic toxicity models. Examples include kits for robust and sensitive measurements of mitochondrial dysfunction, oxidative stress, phospholipidosis and steatosis, cell proliferation, global transcription, protein synthesis, autophagy, and apoptosis.
The HCS Mitochondrial Health Kit measures two important cell-health parameters: mitotoxicity and cytotoxicity (Figures 2 and 3). The MitoHealth stain detects changes in mitochondrial membrane potential, with a loss of signal indicating mitotoxicity. The membrane-impermeant Image-iT® DEAD Green™ reagent detects cytotoxicity by staining cells with compromised plasma membranes. Hoechst 33342 is included in the kit and indicates nuclear morphology. All components are compatible with formaldehyde-based fixation and permeabilization, allowing for multiplexing with other biomarkers of interest.
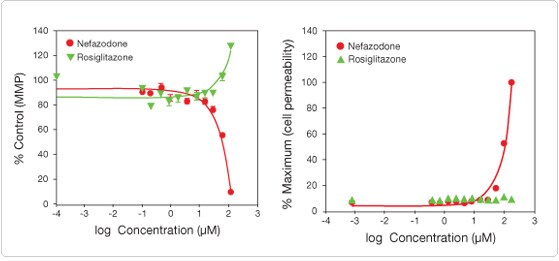
Figure 2. Multiplex measurement of plasma membrane permeability and mitochondrial membrane potential using the HCS Mitochondrial Health Kit. HepG2 cells were plated on collagen-coated plates and treated with various doses of nefazodone or rosiglitazone for 24 hr and stained with (left) MitoHealth (mitochondrial membrane potential) or (right) Image-iT® DEAD Green™ (cell permeability) stains for 30 minutes. The cells were then fixed and counterstained with Hoechst 33342 nuclear stain. Imaging and analysis were performed on the Thermo Scientific Cellomics® ArrayScan® VTI. The data show that nefazodone is more toxic to HepG2 cells than is rosiglitazone.
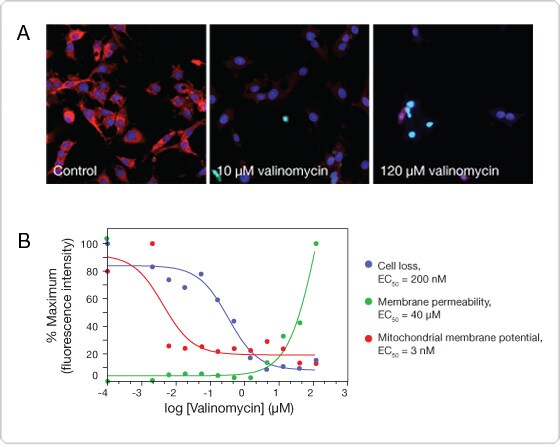
Figure 3. Multiplex analysis of cell loss, mitochondrial membrane potential, and plasma membrane permeability. HepG2 cells were plated on collagen-coated plates, treated with various doses of valinomycin for 24 hr, and stained with the Image-iT® DEAD Green™ and MitoHealth stains (components of the HCS Mitochondrial Health Kit) for 30 min. The cells were then fixed and counterstained with Hoechst nuclear stain. Imaging and analysis were performed on the Thermo Scientific Cellomics® ArrayScan® VTI. (A) Images at selected concentrations of valinomycin. (B) The concentrations of valinomycin were used to calculate EC50 values for cell loss, mitochondrial membrane potential, and plasma membrane permeability.
Click Technology for Multiple Applications
Click technology is an extremely powerful approach for labeling and detecting molecules of interest in cells or tissues, and has proven particularly valuable for HCS applications. The Click-iT® EdU HCS assay is a superior alternative to traditional methods for quantitating newly synthesized DNA. Other nucleic acid–based click technology assays for HCS include the Click-iT® RNA assay for analysis of global transcription and the Click-iT® TUNEL assay for detection of DNA fragmentation (Figure 4), used for the study of cell stress, damage, and death. For protein analysis, the Click-iT® AHA Alexa Fluor® 488 HCS assay provides ready quantitation of nascent protein synthesis, and click-based tools for posttranslational modifications (glycosylation) have also been developed. The Click-iT® RNA and AHA assays are useful for assessing unintended off-target effects in secondary screens. Because the Click-iT® assays are performed in fixed and permeabilized cells, they can be easily combined with other probes such as antibodies and fluorescent dyes in multiparametric analyses.
A recent publication illustrates the utility of click-based HCS assays. Robertson and colleagues [5] used the Click-iT® EdU assay in an effort to image and analyze the properties of cancer stem cells within 3D tumor spheroids. This study revealed subpopulations of metastatic breast cancer cells with characteristics of embryonic stem cells.
 | Figure 4. Late-stage apoptosis visualized using the Click-iT® TUNEL Imaging Assay. HeLa cells were treated with staurosporine, then fixed and permeabilized. The Click-iT® TUNEL Alexa Fluor® 647 Imaging Assay was performed. Activated caspase-3 was detected with a rabbit polyclonal primary antibody for cleaved caspase-3 and labeled with Alexa Fluor® 488 goat anti–rabbit IgG antibody (green). Tubulin was detected with a mouse monoclonal anti-tubulin antibody and labeled with Alexa Fluor® 555 goat anti–mouse IgG (orange). Nuclei were stained with Hoechst 33342 (blue). The light blue color represents an overlay of caspase (green), Hoechst (blue), and TUNEL (magenta) signals. |
Understanding Biology, Enabling Decisions
Drawing on our decades of experience in fluorescence, we offer Molecular Probes® validated tools and assays specific for HCS platforms. These products for automated imaging are validated on multiple platforms and optimized for multiplex applications. Learn more about our solutions for High-Content Screening.
References
- Caie PD, Walls RE, Ingleston-Orme A et al. (2010) Mol Cancer Ther 9:1913–1926.
- Tang D, Kang R, Livesey KM et al. (2010) J Cell Biol 190:881–892.
- Kriston-Vizi J, Lim CA, Condron P et al. (2010) J Biomol Screen 15:869–881.
- Jani JP, Arcari J, Bernardo V et al. (2010) Mol Cancer Ther 9:883–894.
- Robertson FM, Ogasawara MA, Ye Z et al. (2010) J Biomol Screen 15:820–829.
For Research Use Only. Not intended for any animal or human therapeutic or diagnostic use.
For Research Use Only. Not for use in diagnostic procedures.