Search

Attune CytPix Flow Cytometer:
Where data quality, speed, and innovative AI solutions meet
Imaging enhanced flow cytometer enables combined AI-driven morphology and flow data analysis
- The award-winning Invitrogen Attune CytPix Flow Cytometer combines acoustic focusing with a high-speed brightfield camera for simultaneous high throughput flow cytometry and high resolution brightfield imaging.
- AI-driven automated image analysis with the Attune Cytometric Software translates event features into distinct morphology parameters that can be combined with standard fluorescence and scatter parameters to reveal highly reproducible population changes and unique subsets.
- The combination of the Attune CytPix instrument and Attune Cytometric Software allows all users access to advanced data analysis tools without coding or bioinformatics expertise.

The Attune CytPix Flow Cytometer was named one of the 2023 Edison Awards™ winners in the Medtech category. The Edison Awards are among the most prestigious accolades honoring excellence in new product and service development, design, and innovation.
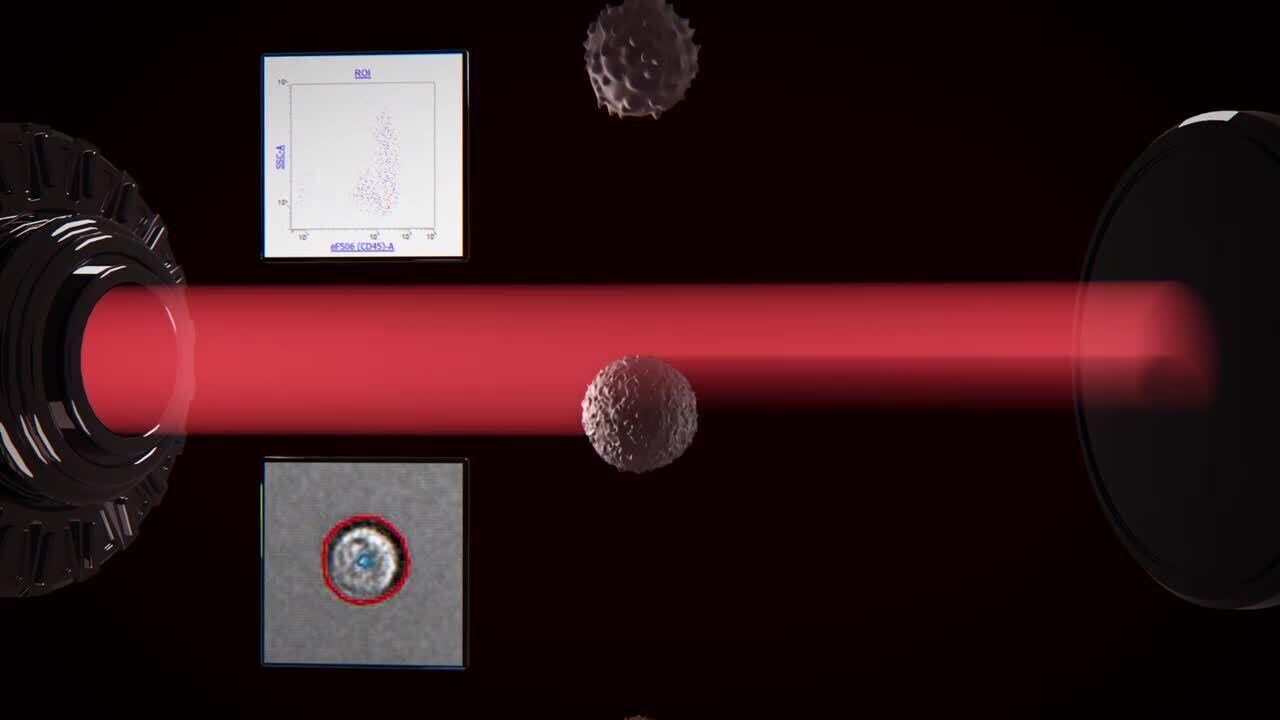
Acoustic focusing–enabled rapid brightfield imaging
As samples are acquired on the Attune CytPix Flow Cytometer, the high-speed brightfield camera captures and stores images of detected events at a rate up to 6,000 images per second, depending on the flow rate and image size. For greater flexibility, Attune Cytometric Software lets you adjust the image capture frequency as needed and select a specific gate for image capture, if required. Users can view event images in real-time to confirm sample quality, optimize protocols, and record the morphology of each cell population identified for analysis. Imaging capture also benefits from acoustic focusing, which helps to position the cells so that a sharp, centered image is obtained.
Acoustic focusing positions cells for optimal imaging
Without acoustic focusing (left), beads appear off-center and often blurry. Acoustic focusing (right) reduces lateral position variation, temporal variations, and depth of field limitations to obtain a sharp image.

AI-driven automated image analysis for morphometric parameters

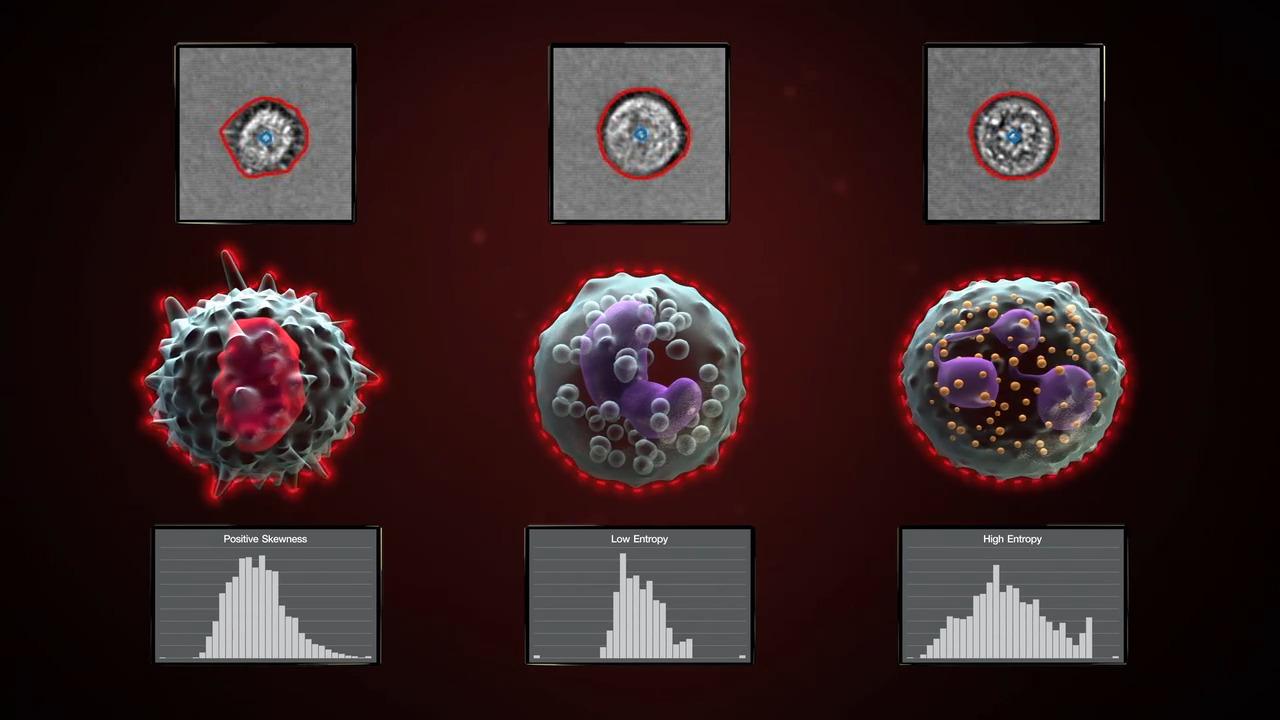
The Attune Cytometric Software has automated image analysis capability to derive morphometric parameters using models pre-trained on leukocytes and beads. The software processes images at a rate of up to 1,000 images/second and can be managed by users in a processing queue that runs in the background of the software. These extended image-based parameters provide data to confirm singlets with cell count (Particle Count) and morphology features such as roundness (Circularity), size (Area Square), shape (Eccentricity) and complexity (Entropy). Gating on these extended parameters allows you to quickly and accurately identify populations of interest and confirm gating strategy with little or no manual review. The Attune software offers access to state-of-the-art machine learning analysis tools within an expertly designed user interface, making it exceptionally easy to use.
Automated image analysis to optimize gating strategy
The Attune CytPix Flow Cytometer allows users to visualize samples during acquisition, verify the accuracy of gating strategies, and support results with reliable documentation for publication purposes.
Optimizing gating strategy. Even robust manual singlet gating is error-prone and remains a subjective decision point in almost all flow cytometry assays. Imaging can be used to confirm and adjust gates to include only single cells of interest.
Here, an experienced user has gated singlets confidently. After evaluating the manual singlet gate, the CytPix image-derived parameter ParticleCount reveals this gate contains more than 4% aggregates.
Perhaps most importantly, these events contain cells of clearly different phenotypes which could lead to incorrect conclusions regarding double positive events (especially in rare populations).

Cell culture quality control. Adding rapid imaging to quality control (QC) workflows can detect and track down cell culture issues early in the process. In one lab, for example, a routine passage check of a Ramos (lymphoma) cell culture observed reduced cell counts and survival despite appearing confluent. Further investigation revealed substantial microbial contamination, but when and where did it begin?
Because the cell line had previously been analyzed on the Attune CytPix Flow Cytometer, the researchers went back to the images and were able to document the microbial infection at least five days earlier. At that time, the early signs were dismissed as debris, but the retrospective evaluation demonstrated shared characteristics with the problematic cells in culture. Tracing the infection helped the lab establish additional laboratory procedures for screening and protection of assay-critical cell lines.

Backgating to discover new populations. Backgating imaged cells on the Attune CytPix Flow Cytometer also allows you to use morphological features to discover interesting subpopulations that would not be apparent from flow cytometry data alone.
For example, E. coli cells incubated over time develop into two types of colony-forming units (CFUs): short CFUs that resemble single cells, and elongated structures with incomplete fission rings, representing incomplete constriction at each approximate cell length. Neither a traditional singlet gate (SSC-A vs SSC-H) nor a fluorescence gate (SSC vs nucleated stain) sufficiently separates these populations. But with the Attune CytPix imaging-enhanced flow cytometer, you can view and group the images and gate the CFU types based on their morphological characteristics.


Discrimination of two E. coli CFU types. E. coli cells were incubated overnight at 37ºC followed by 3 days at 4ºC. Samples were acquired on the Attune CytPix Flow Cytometer at 100 µL/minute. From the images, two types of CFUs were identified: (A) short colonies resembling single cells and (B) elongated structures with incomplete fission rings. Representative images from each population are shown. Backgating on the selected images demonstrated that the two populations are distinct on FSC vs SSC dot plots (orange dots, left).
Data-enriched characterization of cell populations. Morphological information from images can add to the richness of flow cytometry data. For example, the figure shows an otherwise conventional apoptosis assay using Annexin V and PI, adding cell imaging to characterize cells in each population to reveal morphologically distinct features. These insights could not have been gained from multiplex staining alone.

Analyze cell-to-cell interactions using image-derived parameters
Visualize and differentiate coincident events from cell-to-cell interactions. Imaging can even show interactions between cells. In the figure, engineered CAR-T immunotherapy cells were co-incubated with Ramos (lymphoma) cells and stained, acquired, and imaged on the Attune CytPix Flow Cytometer. Images from quadrant Q2 (positive for both stains, acquired as a single event) show the CAR-T cells visibly targeting the Ramos cells, clear evidence of engineered cell potency.

We previously demonstrated the power of imaging CAR-T/Ramos cell interactions. Let’s look at just the population of greatest interest, the double positive events, to learn more. We can now use extended morphological parameters (here, circularity and skewness of intensity) to further examine the features of these populations and refine gating on these events, increasing data robustness. Here, we show that by gating strategies using image-based quantitative parameters can distinguish interacting cells from coincident events to more accurately analyze interacting cells.

Analyze and identify target cell populations with new layers of data
Discover new insights into your experimental data by visualizing populations using combined fluorescence and morphology data. Our software interface wizards enable downsampling, concatenation (merged files) and dimensionality tools that are built into the software for an intuitive, streamlined data analysis experience. Any level user will be able to include all or some (scatter, fluorescence, imaging) parameters as desired and correlate clusters back to workspace plots for analysis.

Built-in dimensionality reduction tools increased resolution into populations. Fluorescently gated populations back-gated onto UMAP plot to confirm expected population resolution in lysed whole human blood. User can view events from each cluster for visual confirmation of cell phenotypes.
Gain insight with rare-population analysis. Because leukocytes (white blood cells or WBCs) comprise only about 0.1% of whole blood cells, the more populous erythrocytes (red blood cells or RBCs) are often lysed to separate them out. However, this may also lyse or alter some WBCs. In a previous application note, we validated a no wash/no lyse method of distinguishing unlysed RBCs, WBCs, and platelets, using the property that hemoglobin in RBCs readily absorbs violet (405 nm) light, while WBCs and platelets do not. This shifts the RBCs to the right on a blue vs violet side scatter (SSC) plot, using the Attune CytPix No-Wash, No-Lyse Filter Kit to allow dual-laser light scatter detection (Panel A).
Staining WBCs for CD45 expression, however, shows that some WBCs (pale blue in the dot plot) appear in the erythrocyte gate. To analyze further, the Attune CytPix Flow Cytometer was set to image CD45+ events, presumed to represent WBCs. The images (Panel B) demonstrated that some of these events (with dots backgated in purple) actually represent clusters, small platelets, dark RBCs, or combinations of cells analyzed as single events. What appeared to be a homogeneous population is actually more diverse—an insight that should be considered when interpreting results.

No wash/no lyse leukocyte analysis with imaging. Cells were acquired from 24-hour-old blood by dilution in 1 mM EDTA (<1:4,000). Samples were stained with FITC anti-CD45 using a no wash/no lyse protocol and acquired on an Attune CytPix Flow Cytometer equipped with the Attune CytPix No-Wash, No-Lyse Filter Kit to allow dual-laser light scatter detection. (A) A dot plot of blue vs violet SSC shows separate regions for erythrocytes vs platelets and leukocytes. However, some CD45+ events (pale blue) appear in the erythrocyte region. (B) Gating and imaging on only CD45+ events shows that some events (purple dots) represent clusters, platelets, RBCs, or combinations of these or other cells.
Leverage cutting-edge AI/ML tools for enhanced analysis. Attune CytPix software brings the power of advanced AI and machine learning to your laboratory. The morphology parameters are new markers for identifying target cell populations. Users can correlate phenotype with function, employ label-free profiling for rare populations, and find populations based on morphological similarity.
The image similarity feature enables users to choose a reference image and find events with similar morphology throughout a sample. Images can be sorted according to the percent similarity calculation and backgated onto any flow plot. With this calculation, a dynamic similarity percentage parameter for each reference event can be plotted against any parameters for more insight about the population.

Quickly find events of similar morphology using image similarity feature. The image similarity feature helps find events of similar morphology image quickly. Human T cells were cultured with IL-2 and Gibco Dynabeads Human T-Activator CD3/CD28 for T Cell Expansion and Activation, leaving expanded cells and residual detached beads in the final sample. Similarity scores can be calculated for any user image, and the entire image view gallery can be sorted by this score to find morphologically similar events. (A) Similarity scores can be used as plot parameters or events can be backgated to workspace plots as shown in the graphs, with orange dots representing images >70% similar to the reference Event 225. (B) Multiple similarity scores can be calculated, as shown here with backgated events in blue ranked by reference event 219.
Tailor, train, and transform your data analysis like never before
The Attune CytPix software provides the capability to create an unlimited number of retrained models, which can also be exported and shared to support collaboration. This interactive retraining feature allows users to refine the vendor supplied AI models to reflect their subject matter expertise to improve accuracy across a variety of sample types and applications. Both mask fit and counting statistics may be improved after model retraining, as shown in figures below with differentiated macrophages.

Expert UX/UI enables users to train AI models for expanded applications. (A) The “Train Model” feature provides annotation tools and real-time model training accuracy. (B) RAW 264.7 macrophages are often annotated inaccurately with respect to particle count due to their complexity and noncircular borders. The number of singlets available for analysis increases once the user trains and employs a more accurate model.
Educational videos and webinars


Videos for using the Attune CytPix Flow Cytometer


Related pages


For Research Use Only. Not for use in diagnostic procedures.