Search Thermo Fisher Scientific
Fluorescent Probes
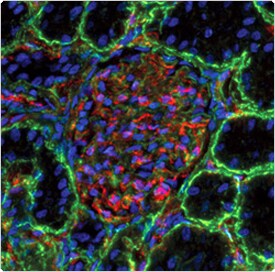
The use of fluorescent molecules in biological research is the standard in many applications, and their use is continually increasing due to their versatility, sensitivity and quantitative capabilities. Among their myriad of uses, fluorescent probes are employed to detect protein location and activation, identify protein complex formation and conformational changes and monitor biological processes in vivo. Immunofluorescence methods were used to provide this representative image.
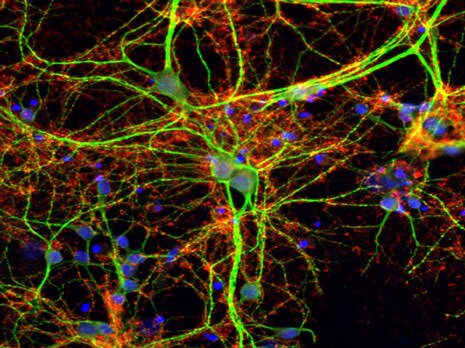
Detection of target proteins using fluorophore-conjugated antibodies. Synaptophysin (red) and microtubule-associated protein 2 (MAP2; green) in mouse cortical neurons were fluorescently labeled with specific primary antibodies and Thermo Scientific DyLight 650-Conjugated Goat Anti-Rabbit or DyLight 488-Conjugated Goat Anti-Mouse secondary antibodies, respectively. Nuclei in both panels were labeled with Hoechst dye.
View and select products
Introduction to fluorescence
The mechanism of fluorescence
Fluorescent molecules, also called fluorophores or simply fluors, respond distinctly to light compared to other molecules. As shown below, a photon of excitation light is absorbed by an electron of a fluorescent particle, which raises the energy level of the electron to an excited state. During this short excitation period, some of the energy is dissipated by molecular collisions or transferred to a proximal molecule, and the remaining energy is emitted as a photon to bring the electron back to its ground state. Because the emitted photon usually carries less energy and therefore has a longer wavelength than the excitation photon, the emitted fluorescence can be distinguished from the excitation light. The excitation and photon emission from a fluorophore is cyclical, and until the fluorophore is irreversibly damaged (see Photo bleaching; below), it can be repeatedly excited. Fluorophores can thus emit numerous photons through this cycle of excitation and emission and fluorescent molecules are therefore used for a broad range of research applications.
Watch this video to learn more about fluorescence basics.
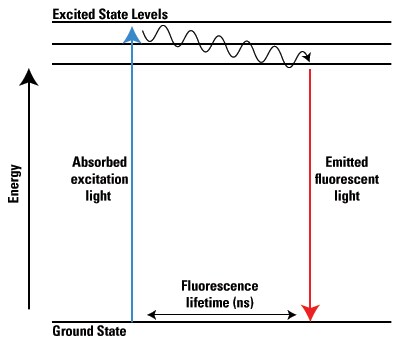
Jablonski energy diagram of fluorescence.
Protein assay technical handbook
This technical handbook and product guide will help you to select an appropriate assay method based on assay time, sensitivity, compatibility, standard curve linearity, and protein-to-protein variation. Learn about our wide range of colorimetric (copper or dye-based) and fluorescent protein assays, as well as our more specialized assays to quantify peptides, antibodies, protein modifications, or functional (enzymatic) classes of proteins. Discover tools and strategies to help optimize your protein quantitation assays to ensure more accurate downstream results

Fluorescence spectra
Both the excitation and emission wavelengths are specific characteristics for each fluorophore, and while these wavelengths are discrete for monoatomic fluorophores, polyatomic fluorophores exhibit broad excitation and emission spectra. The spectra for fluorescent molecules (both mono- and polyatomic) are graphed on x,y plots that indicate the wavelengths that correspond to the maximum and minimum excitation and emission signal intensity for each fluorophore, as shown below (left panel). It is important to note that while the emission wavelength is independent of the excitation wavelength due to partial loss of energy prior to emission (as shown above), the emission intensity is proportional to the amplitude of the excitation wavelength, as indicated by the excitation energies (Ex1 and Ex2) and their corresponding emission intensities (Em1and Em2, respectively) in the graph below (right panel) (2).
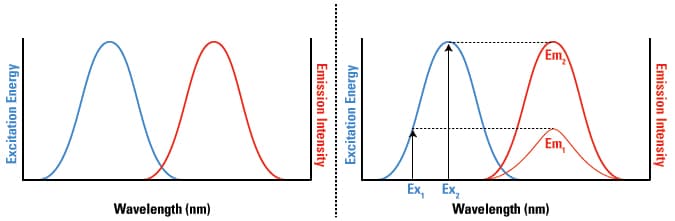
The excitation and emission spectra of a fluorophore and the correlation between the excitation amplitude and the emission intensity. General diagram of the excitation and emission spectra for a fluorophore (left). The intensity of the emitted light (Em1 and Em2) is directly proportional to the energy required to excite a fluorophore at any excitation wavelength (Ex1 and Ex2, respectively; right).
Stokes shift
The distance between the excitation and emission wavelengths is called the Stokes Shift (see below) and is a key aspect in the detection of the emitted fluorescence in biological applications. Stokes shift is also a distinct characteristic of each fluorophore. For example, the detection of emitted fluorescence can be difficult to distinguish from the excitation light when using fluorophores with very small Stokes shifts (right panel), because the excitation and emission wavelengths greatly overlap. Conversely, fluorophores with large Stokes shifts (left panel) are easy to distinguish because of the large separation between the excitation and emission wavelengths. Stokes shift is especially critical in multiplex fluorescence applications, because the emission wavelength of one fluor may overlap, and therefore excite, another fluor in the same sample.
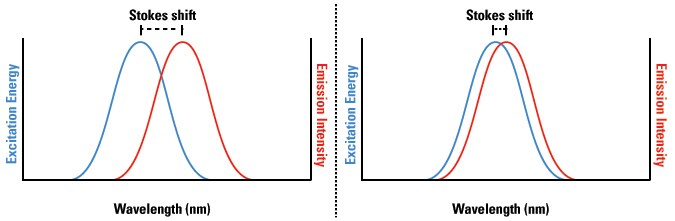
Stokes shift of the excitation and emission spectra of a fluorophore. Fluorophores with greater Stokes shifts (left) show clear distinction between excitation and emission light in a sample, while fluorophores with smaller Stokes shifts (right) exhibit greater background signal because of the smaller difference between excitation and emission wavelengths.
Range of colors
The electromagnetic spectrum is a broad range of all wavelengths of electromagnetic radiation, and the visible light spectrum is limited to a very small subset of these wavelengths, as shown below. Early fluorescence-based research applications employed fluorophores that only emitted in the visible range of the electromagnetic spectrum (390–700 nm) because of limitations in detecting beyond the visible spectrum. Technological advances now allow for detection of fluorophores beyond the boundaries of the visible spectrum and into the ultraviolet (UV) and infrared (IR) ranges of the electromagnetic spectrum. These new fluorophores and detectors offer greater variability, versatility, and multiplexing capabilities for new and developing applications.
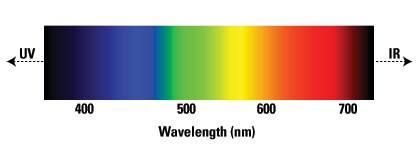
Visible light spectrum indicating approximate wavelengths.
Fluorophore brightness
The brightness of a given fluorophore is determined by the molar extinction coefficient and quantum yield, both of which are specific for each fluor. The molar extinction coefficient (ε) is defined as the quantity of light that can be absorbed by a fluor at a given wavelength and is measured in M-1 cm-1. The quantum yield (Φ) is calculated as the number of photons that are emitted by the fluor divided by the number of photons that are absorbed. This calculation provides the efficiency of a fluorophore and has a maximum of 1. The brightness of a fluorophore is then calculated as the product of ε and Φ.
Types of fluorophores
Fluorescence has been used in biological research for the last 100 years, although developments in fluorescence chemistry, along with technical discoveries, have fueled the development of many different kinds of fluorophores. The vast selection of fluorophores today provides greater flexibility, variation and fluorophore performance for research applications than ever before. Fluorophores can be divided into three general groups:
- Organic dyes
- Biological fluorophores
- Quantum dots
Each fluorophore has distinct characteristics, which should be considered when deciding which fluorophore to use for a given application or experimental system.
Organic dyes
Synthetic organic dyes, such as fluorescein, were the first fluorescent compounds used in biological research. Derivatives of these original compounds have been produced to improve their photostability and solubility. These dyes are also derivatized for use in bioconjugation, especially fluorescein isothiocyanate (FITC), rhodamine (tetramethyl rhodamine isothiocyanate, TRITC) and commercial variants with greater performance. The small size of these fluors is a benefit over biological fluorophores for bioconjugation strategies because they can be crosslinked to macromolecules, such as antibodies, biotin or Avidin, without interfering with proper biological function. A wide variety of dyes with characteristic excitation/emission spectra and optimal quantum yields and excitation coefficients are commercially available for any fluorescence application.
Biological fluorophores
While bioluminescence has been known for millennia, the first use of a biological fluorophore for research applications occurred in the 1990s, when green fluorescent protein (GFP) was cloned from the jellyfish Aequorea victoria and used as a gene expression reporter (3). Since that time, derivatives of the original GFP, phycobiliproteins (allophycocyanin), phycocyanin, phycoerythrin, and phycoerythrocyanin) and many other proteins have been designed for use in biological expression systems, and their use is now commonplace in biological research.
The benefit of these types of fluorophores is that expression plasmids can be introduced into either bacteria, cells, organs or whole organisms, to drive expression of that fluorophore either alone or fused to a protein of interest in the context of the biological processes studied. The use of fluorescent proteins can be time consuming, and expressing large amounts of light-producing proteins can generate reactive oxygen species and induce artefactual responses or toxicity. Additionally, the size of the fluorescent protein can change the normal biological function of the cellular protein to which the fluorophore is fused, and biological fluorophores do not typically provide the level of photostability and sensitivity offered by synthetic fluorescent dyes.
Quantum dots
Quantum dots are nanocrystals with unique chemical properties that provide tight control over the spectral characteristics of the fluor. Quantum dots were developed in the 1980s and since the 1990s have been increasingly used in fluorescence applications in biological research. Quantum dots are nanoscale-sized (2-50 nm) semiconductors that, when excited, emit fluorescence at a wavelength based on the size of the particle; smaller quantum dots emit higher energy than large quantum dots, and therefore the emitted light shifts from blue to red as the size of the nanocrystal increases. And because quantum dot size can be tightly controlled, there is greater specificity for distinct excitation and emission wavelengths than other fluors.
Multicolor immunofluorescence imaging with Qdot secondary antibody conjugates. Laminin in a mouse kidney section was labeled with an anti-laminin primary antibody and visualized using green-fluorescent Qdot 565 IgG. PECAM (platelet/endothelial cell adhesion molecule; CD31) was labeled with an anti–PECAM-1 primary antibody and visualized using red-fluorescent Qdot 655 IgG. Nuclei were stained with blue-fluorescent Hoechst 33342
Quantum dots have also been reported to be more photostable than other fluorophores, as one report showed that quantum dots remained fluorescent for 4 months in an in vivo imaging study (1). Additionally, quantum dots can be coated for use in different biological applications such as protein labeling. While the use of quantum dots in biological applications is increasing, there are reports of cell toxicity in response to the breakdown of the particles (4) and their use can be cost-prohibitive.
Protein detection technical handbook
This 84-page handbook provides a deep dive about the last step in a western blot workflow—protein detection. With a variety of detection techniques to choose from (chemiluminescence, fluorescence or chromogenic), you can select a technology to match your experimental requirements and the instruments you have available. Quick visualization or precise quantitation, single-probe detection or multiplexing — a range of reagents and kits for western blot detection and subsequent analysis are available.

Fluorescence detection and quantitation
Detection strategies
Many different types of fluorescence detection instruments have been developed, and while each is specific for distinct experimental methods, all fluorescence detection instruments have four basic requirements:
- An excitation light source, such as lasers, photodiodes, or lamps (xenon arc and mercury vapor being the most commonly used lamps)
- A fluorophore
- Filters to isolate specific wavelengths to excite different fluorophores
- A detector that records the output, which is usually an electronic signal
While this list is not exhaustive and new instrumentation is continually developed, common fluorescence detection instrumentation includes:
- Fluorescent microscopes – detect localized fluors in samples in both two and three dimensions
- Fluorescence scanners, such as microarray readers – detect localized fluors in samples in two dimensions
- Spectrofluorometers and microplate readers – record the average fluorescence in samples
- Flow cytometers – analyze the fluorescence of individual cells in a sample population
Watch this video to learn more about flow cytometry
Quantitation
With the advent of digital microscopy, fluorescent signal quantitation has become commonplace in all fluorescent applications and provides the ability to measure a broad range of parameters, including:
- Cell number
- Amount of fluorophore localized to cells or even discrete cellular compartments
- Rate of gene expression and protein synthesis
- Rate of cell motility or movement of intracellular components
- Amount of DNA, RNA or protein in a sample
- DNA, RNA or protein sequence
- Enzyme activity
- Viability
Fluorescence quantitation requires specialized software and, depending on the experimental approach, fluorescent standards may be required to calibrate the instrumentation.
Fluorescent labeling
Fluorescent labeling is the process of covalently attaching a fluorophore to another molecule, such as a protein or nucleic acid. This is generally accomplished by using a reactive derivative of the fluorophore that selectively binds to a functional group present in the target molecule. The most commonly labeled molecules are antibodies, which are then used as specific probes for the detection of a particular target. Fluorescent labeling can be applied to a wide variety of detection systems and allows sensitive and quantitative measurements.
Fluorophore conjugation
A chemically reactive derivative of a fluorophore is required for labeling molecules. Common reactive groups include amine-reactive isothiocyanate derivatives including FITC, amine-reactive succinimidyl esters such as NHS-fluorescein or NHS-rhodamine, and sulfhydryl-reactive maleimide-activated fluors such as Fluorescein-5-maleimide. Reaction of any of these reactive dyes with another molecule results in a stable covalent bond formed between the fluorophore and the labeled molecule. Isothiocyanates have long been used as a primary reactive chemistry for attaching fluorescent dyes to proteins through the primary amines of lysine side chains. NHS-ester chemistry is now the preferred labeling method, because it has greater specificity towards primary amines and produces a more stable linkage following the labeling procedure. Sulfhydryl-reactive chemistries occupy a smaller niche in protein labeling where lysine residues must be preserved or where a cysteine residue is specifically targeted to localize the fluorescent dye on the labeled protein.
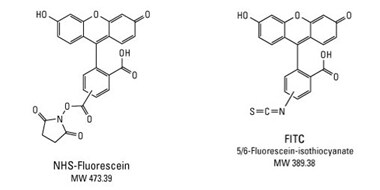
Structures of NHS-Fluorescein and FITC; two amine-reactive derivatives of fluorescein.
NHS-fluorescein is activated with the N-hydroxy-succinimidyl-ester (NHS ester) functional group. Compared to FITC, the NHS-ester derivative has greater specificity toward primary amines in the presence of other nucleophiles and results in a more stable linkage following labeling.
| NHS-Fluorescein | FITC | |
| Alternative names | 5/6-FAM SE | 5/6-FITC |
| Chemical name | 5/6-carboxyfluorescein succinimidyl ester | 5(6)-fluorescein isothiocyanate mixed isomer |
| Molecular weight | 473.4 | 389.2 |
| Excitation source | 488 nm spectral line, argon-ion laser | 488 nm spectral line, argon-ion laser |
| Excitation wavelength | 494 nm | 494 nm |
| Emission wavelength | 518 nm | 518 nm |
| Extinction coefficient | > 70,000/M cm | > 70,000/M cm |
| CAS # | 117548-22-8 | 27072-45-3 |
| Purity | > 90 % by HPLC | > 95 % by HPLC |
| Solubility | Soluble in DMF or DMSO | Soluble in aqueous buffers to pH > 6 |
| Storage | Desiccated at -20 %, protect from moisture, use only fresh solutions | Desiccated at -20 %, protect from moisture, use only fresh solutions |
| Reactive groups | NHS ester, reacts with primary amines at Ph 7.0 TO 9.0 | Isothiocyanate, reacts with primary amines at pH 7.0 to 9.0 |
Comparison of NHS-Fluorescein and FITC.
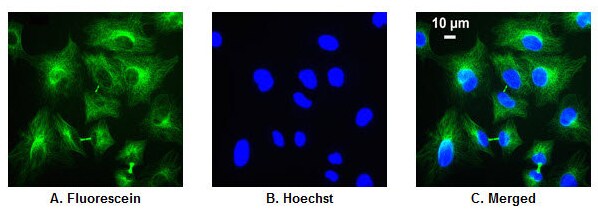
Detection of α-tubulin with fluorescein-labeled secondary antibody. A549 human lung carcinoma cells were grown in 96-well microplates for 18-20 hr, fixed with 4% paraformaldehyde (Part No. 28906) and permeabilized with 0.1% Surfact-Amps X-100 (Part No. 28314). Cells were then probed with a mouse anti-α-tubulin primary antibody (0.4 µg/mL) and Fluorescein-goat anti-mouse secondary antibody (2 µg/mL). Nuclei were labeled with Hoechst Dye. Images were acquired by fluorescence microscopy. A.Fluorescence image shows a delicate network of α-tubulin (pseudo-colored green) located exclusively in the cytoplasm. B. Nuclear counterstain with Hoechst Dye (pseudo-colored blue) C. Merged image.
Molecules must be labeled sufficiently to detect the fluorescent signal while not interfering with the normal biological characteristics of the molecule, including function, solubility, binding capacity or activation. Therefore, fluorescent labeling requires optimization.
Unreacted fluorophore removal
Following a fluorescent labeling reaction, it is often necessary to remove any nonreacted fluorophore from the labeled target molecule. This is usually accomplished by size exclusion chromatography, taking advantage of the size difference between the fluorophore and labeled protein, nucleic acid, etc. However, many fluorophores interact with typical separation matrices causing poor recovery and separation. For this reason, specialized dye removal columns that account for the hydrophobic properties of fluorescent dyes are preferred. It is possible to remove dye molecules from proteins as small as 7kDa and as large as IgG (150 kDa) using commercially available dye removal columns.
Factors that influence fluorescence emission or detection
Quenching
Fluorophore emission can be directly influenced by interaction with other fluorescent or non-fluorescent molecules, which can "quench" the emitted fluorescence from the excited fluorophore. Fluorescence quenching is often used to determine the activation status of proteins or identify gene expression, since quenchers can be designed to be added or removed in response to biological events.
The extent of quenching depends on the nature of the quencher molecule (fluorophore or non-fluorophore), the type of interaction, and the wavelength of energy that is emitted by the fluor. Methods of fluorescent quenching include fluorescence resonance energy transfer (FRET), collision quenching and contact quenching, which are diagrammed below.
In FRET (also called Förster resonance energy transfer), the excitation light raises a "donor" fluor to an excited state, which results in the release of a photon. An "acceptor" molecule, which can be another fluor or a non-fluorescent molecule, is designed to be in close enough proximity with the donor fluor to absorb the emitted photon, which then effectively quenches the emitted light in the case of non-fluorescent molecules. The emitted photon is also quenched when using fluors as quenchers, and if the absorbed photon is within the excitation wavelength range of the second fluor, the acceptor electron will be raised to an excited state and release a photon at the wavelength of the acceptor fluor. The use of another fluor as a quencher is often used to detect the quenched state of the donor fluor, because instead of detecting fluorescence at a known wavelength in response to excitation of the donor fluor, a quenched fluor would emit at the wavelength of the quenching fluor.
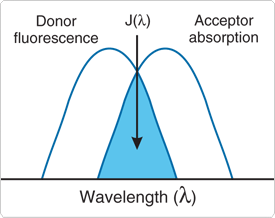
Schematic representation of the FRET spectral overlap integral. This process is a distance-dependent interaction between the electronic excited states of two dye molecules in which excitation is transferred from a donor molecule to an acceptor molecule without emission of a photon.
| Donor | Acceptor | R0 (Å) |
| Fluorescein | Tetramethylrhodamine | 55 |
| IAEDANS | Fluorescein | 46 |
| EDANS | Dabcyl | 33 |
| Fluorescein | Fluorescein | 44 |
| BODIPY FL | BODIPY FL | 57 |
| Fluorescein | QSY 7 and QSY 9 dyes | 61 |
Table 1. Typical Values of R0 for Forster Radius-NOTE: o in Forster has two dots above it
Contact quenching occurs when a fluorophore is complexed with a quenching molecule prior to excitation; because of direct contact of the fluor with the other molecule, the energy from excitation is immediately transferred to the contact molecule, and this energy is then lost by heat. Collision quenching occurs when an excited fluorophore reacts with a quencher molecule in solution, which immediately causes the transfer of energy to the contact molecule and the relaxation of the excited fluor.
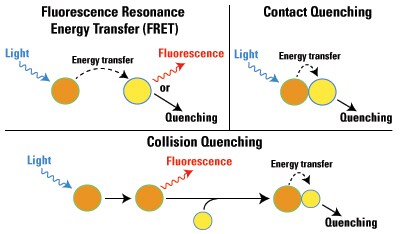
Diagram of the types of fluorescence quenching.
Background fluorescence
Fluorophore detection in a given experiment can be obscured by high background fluorescence, which is most commonly caused by insufficient removal of nonbound fluorescent probe or sample auto fluorescence. Thorough washing or a reduction in the concentration of fluorescent probe can reduce background fluorescence. However, consideration of the right probe sets or equipment is required to address auto fluorescence, which is defined as the endogenous fluorescence of components in a sample. Auto fluorescence in biological samples most often emits when using shorter-wavelength excitation light (usually <500 nm). Therefore, auto fluorescence can be minimized or avoided by either using fluors that do not excite in the same spectrum as the sample or filter sets that narrow the excitation light specifically to that of the target fluor(s).
Low fluorescence
Low fluorescence intensity can limit the detection of the target fluorophore, especially when background fluorescence is high. Fluorescence intensity can be augmented by increasing the number of fluorescent molecules at the target site. This can be done by using either a higher concentration of the probe in the experiment or amplification methods to increase the localization of the fluorophore to the target site. Both approaches can negatively affect signal detection, though, because increasing the concentration of probe can precipitate probe molecules and cause cellular distortions (especially with intracellular probes) or self-quenching (because of the high level of intermolecular interactions; see Quenching above) or induce cell death.
Besides accumulating the number of fluorescent probes in a system, low fluorescence intensity can sometimes be increased by raising the excitation light intensity because the excitation intensity is directly proportional to the excitation energy. Using this approach must be balanced, though, with avoiding photo bleaching the fluorophore, as described below.
Photo bleaching
Photo bleaching is caused by the irreversible destruction of fluorophores due to either the prolonged exposure to the excitation source or exposure to high-intensity excitation light. Photo bleaching can be minimized or avoided by exposing the fluor(s) to the lowest possible level of excitation light intensity for the shortest length of time that still yields the best signal detection; this requires optimization of the detection method using high sensitivity CCD cameras, high numerical aperture objective and/or the widest bandpass emission filter(s) available. Other approaches include using fluorophores that are more photo stable than traditional fluorophores and/or using antifade reagents to protect the fluor(s) against photo bleaching. Steps to avoid photo bleaching are not feasible for all detection methods and should be optimized for each method used. For example, intifada reagents are toxic to live cells, and therefore they can only be used with fixed cells or tissue. Furthermore, some detection methods, such as flow cytometry, normally do not require steps to avoid photo bleaching because of the extremely short exposure time of the fluorophore to the excitation source. The example below illustrates the phenomenon of fluorescence photo bleaching.
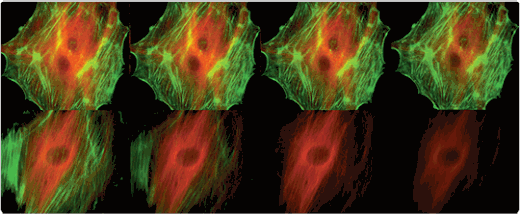
Comparison of the photo bleaching rates of the Invitrogen Alexa Fluor 488 and Alexa Fluor 546 dyes and the well-known fluorescein and Cy3 fluorophores. The cytoskeleton of bovine pulmonary artery endothelial cells (BPAEC) was labeled with (top series) Alexa Fluor 488 phalloidin and mouse monoclonal anti–a-tubulin antibody in combination with Alexa Fluor 546 goat anti–mouse IgG antibody or (bottom series) fluorescein phalloidin and the anti–a-tubulin antibody in combination with a commercially available Cy3 goat anti–mouse IgG antibody. The pseudocolored images were taken at 30-second intervals (0, 30, 90, and 210 seconds of exposure). The images were acquired with bandpass filter sets appropriate for fluorescein and rhodamine.
Recommended reading
- Ballou B. et al. (2004) Noninvasive imaging of quantum dots in mice. Bioconjug Chem. 15, 79-86.
- Encyclopedia of Chromatography: J. Cazes (Ed.); Marcel Dekker Inc., New York, 2001
- Chalfie M. et al. (1994) Green fluorescent protein as a marker for gene expression. Science. 263, 802-5.
- Mahendra S. et al. (2008) Quantum dot weathering results in microbial toxicity. Environ Sci Technol. 42, 9424-30.
For Research Use Only. Not for use in diagnostic procedures.